KEI Industries

  • Market Cap: Mid Cap
  • Industry: Cables - Electricals
  • ISIN: INE878B01027
  • NSEID: KEI
  • BSEID: 517569
INR
5,232.50
62.5 (1.21%)
BSENSE

Sep 03, 09:43 AM

BSE+NSE Vol: 70.14 k

  • Price Points
  • Score
  • Mojo Parameters
  • Total Return
  • News and Corporate Actions
  • Key factors
  • Shareholding
  • Financials
  • CompanyCV
stock-summaryPrice Point
High/Low

1Day

52 Week

Valuation
Technical
Day's Volume

CASH

70.14 k (2.50%) Volume

Shareholding (Jun 2026)

FII

27.32%

Held by 336 FIIs

DII

25.90%

Held by 47 DIIs

Promoter

35.00%

Why is KEI Industries Ltd falling/rising?

03-Sep-2026

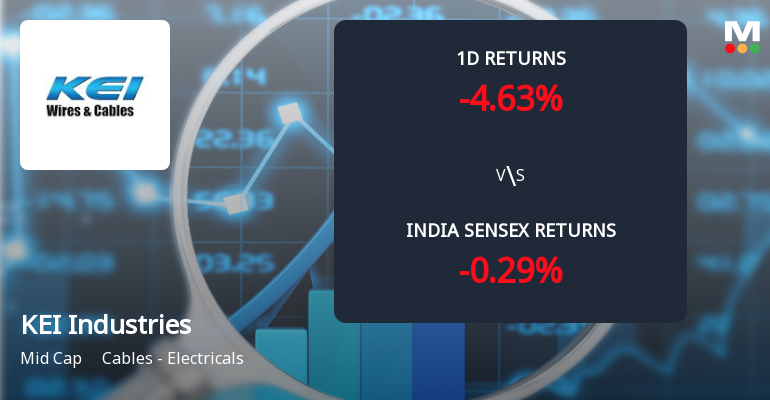
As of 02-Sep, KEI Industries Ltd's stock price is at 5,170.00, down 3.1% and part of a two-day decline totaling 7.68%. Despite a strong year-to-date performance, the stock is currently facing bearish trends influenced by moving averages and overall market conditions.

As of 02-Sep, KEI Industries Ltd's stock price is falling, currently at 5,170.00, which reflects a decrease of 165.2 points or 3.1%. This decline is part of a broader trend, as the stock has been losing value for the last two days, resulting in a total drop of 7.68% during this period. Additionally, the stock has underperformed its sector by 1.38% today.<BR><BR>In terms of recent performance, the stock has experienced a weekly decline of 6.57%, contrasting with a monthly gain of 3.44%. Despite a strong year-to-date performance of 15.92% and a notable 30.60% increase over the past year, the current downward movement is significant. The stock's price touched an intraday low of Rs 5,131.45, indicating a loss of 3.82% at that point.<BR><BR>Investor sentiment may be influenced by the stock's moving averages, which indicate that while it is above the 200-day moving average, it is below the shorter-term moving averages (5-day, 20-day, 50-day, and 100-day). This could suggest a bearish trend in the short term. Furthermore, while there has been a rise in investor participation, with delivery volume increasing by 87.71% against the 5-day average, the overall market conditions and the stock's recent performance contribute to its current decline.

View full answer

Who are in the management team of KEI Industries?

01-Sep-2026

The management team of KEI Industries includes Anil Gupta (Chairman & Managing Director), Archana Gupta (Non-Executive Director), Akshit Diviaj Gupta (Whole-time Director), and several independent directors, including Pawan Bholusaria and K G Somani. This team is responsible for guiding the company's strategic direction and operations.

The management team of KEI Industries includes the following key individuals:<BR><BR>1. **Anil Gupta** - Chairman & Managing Director<BR>2. **Archana Gupta** - Non-Executive & Non-Independent Director<BR>3. **Akshit Diviaj Gupta** - Whole-time Director<BR>4. **Pawan Bholusaria** - Independent Non-Executive Director<BR>5. **K G Somani** - Independent Non-Executive Director<BR>6. **Vijay Bhushan** - Independent Non-Executive Director<BR>7. **Vikram Bhartia** - Independent Non-Executive Director<BR>8. **Sadhu Ram Bansal** - Independent Non-Executive Director<BR>9. **Rajeev Gupta** - Executive Director (Finance)<BR>10. **Shalini Gupta** - Non-Executive & Independent Director<BR><BR>This team plays a crucial role in guiding the company's strategic direction and operations.

View full answer

What does KEI Industries do?

01-Sep-2026

KEI Industries Ltd is a leading Indian manufacturer of wire and cable solutions, established in 1968 and converted to a public company in 1992. As of June 2026, it reported net sales of ₹3,185 Cr and a net profit of ₹274 Cr, with a market cap of ₹52,571 Cr.

Overview:<BR>KEI Industries Ltd is India's leading manufacturer of wire and cable solutions, operating within the Cables - Electricals industry and categorized as a Mid Cap company.<BR><BR>History:<BR>KEI Industries Limited commenced operations in 1968 as a Partnership Firm named "Krishna Electrical Industries" and was converted into a Public Limited Company on 31st December 1992. The latest quarterly results reported net sales and net profit for June 2026.<BR><BR>Financial Snapshot:<BR>- Net Sales: 3,185 Cr (Quarterly Results - Jun 2026)<BR>- Net Profit: 274 Cr (Quarterly Results - Jun 2026)<BR>- Market Cap: INR 52,571 Cr (Mid Cap)<BR><BR>Key Metrics:<BR>- P/E: 54.00<BR>- Industry P/E: 48<BR>- Dividend Yield: 0.08%<BR>- Debt Equity: -0.19<BR>- Return on Equity: 13.78%<BR>- Price to Book: 7.99<BR><BR>Contact Details:<BR>Address: D-90 Okhla Industrial Area, Phase-I New Delhi New Delhi : 110020<BR>Tel: 91-11-26818840/8642<BR>Email: cs@kei-ind.com<BR>Website: http://www.kei-ind.com

View full answer

Who are the peers of the KEI Industries?

01-Sep-2026

KEI Industries' peers include Polycab India, R R Kabel, Finolex Cables, and others, with varying management risks and growth rates. R R Kabel leads in 1-year returns at 150.82%, while KEI Industries has a return of 47.05%.

Peers: The peers of KEI Industries are Polycab India, R R Kabel, Finolex Cables, Universal Cables, Advait Energy, Dynamic Cables, Paramount Comm., Quadrant Future, and V-Marc India.<BR><BR>Quality Snapshot: Excellent management risk is observed at Polycab India, KEI Industries, and R R Kabel, while Average management risk is found at Universal Cables, Advait Energy, Dynamic Cables, Paramount Comm., and V-Marc India, with Quadrant Future having Below Average management risk. Growth is Excellent for Polycab India, KEI Industries, R R Kabel, Advait Energy, and Paramount Comm., while Average growth is noted for Finolex Cables and Dynamic Cables, and Good growth is seen at Universal Cables. Capital Structure is Excellent for Polycab India, KEI Industries, R R Kabel, and Advait Energy, while it is Below Average for Universal Cables and Average for Finolex Cables, Dynamic Cables, Paramount Comm., and V-Marc India.<BR><BR>Return Snapshot: R R Kabel has the highest 1-year return at 150.82%, while V-Marc India has the lowest at 0.00%. KEI Industries' 1-year return of 47.05% is significantly higher than V-Marc India but lower than R R Kabel. Additionally, Finolex Cables and V-Marc India have negative six-month returns.

View full answer

How big is KEI Industries?

01-Sep-2026

As of 31st August, KEI Industries Ltd has a market capitalization of 52,571.00 Cr, with recent net sales of 12,342.79 Cr and a net profit of 996.82 Cr.

As of 31st August, KEI Industries Ltd has a market capitalization of 52,571.00 Cr, categorizing it as a Mid Cap company.<BR><BR>In the latest four quarters, KEI Industries reported Net Sales of 12,342.79 Cr and a Net Profit of 996.82 Cr.<BR><BR>The latest annual period for the balance sheet is March 2025, with Shareholder's Funds amounting to 5,785.75 Cr and Total Assets valued at 7,234.60 Cr.

View full answer

Are KEI Industries Ltd latest results good or bad?

04-Aug-2026

KEI Industries Ltd's latest Q1 FY27 results are strong, with a 40.05% year-on-year increase in net profit to ₹274.14 crore and a 22.97% revenue growth to ₹3,185 crore, despite a seasonal decline. The operating margin reached a record high of 12.43%, indicating effective management and operational efficiency.

KEI Industries Ltd's latest results for Q1 FY27 can be considered quite good overall. The company reported a net profit of ₹274.14 crore, which is a significant increase of 40.05% year-on-year. Revenue also saw a healthy growth of 22.97% year-on-year, reaching ₹3,185 crore. <BR><BR>One of the standout features of this quarter was the operating margin, which expanded to 12.43%, marking the highest quarterly margin on record for the company. This reflects strong operational efficiency and pricing power, despite a typical seasonal decline in demand during the monsoon months.<BR><BR>While there was a sequential decline in revenue and net profit compared to the previous quarter, this is largely attributed to seasonal trends rather than any fundamental weakness in the business. The overall financial performance indicates that KEI Industries is effectively managing its operations and capitalizing on market opportunities, positioning itself well for future growth. <BR><BR>In summary, the results highlight robust profitability and operational excellence, making them favorable in the context of the company's performance and market conditions.

View full answer

Should I buy, sell or hold KEI Industries Ltd?

04-Aug-2026

When is the next results date for KEI Industries Ltd?

22-Jul-2026

The next results date for KEI Industries Ltd is 03 August 2026.

The next results date for KEI Industries Ltd is scheduled for 03 August 2026.

View full answer

Has KEI Industries Ltd declared dividend?

23-Jan-2026

Yes, KEI Industries Ltd has declared a dividend of 225%, amounting to ₹4 per share, with an ex-date of January 28, 2026. While recent total returns have been mixed, the company has shown substantial growth over the past five years.

KEI Industries Ltd has declared a dividend.<BR><BR>Dividend Details:<BR>- Percentage announced: 225%<BR>- Amount per share: 4<BR>- Ex-date: 28 Jan 26<BR><BR>Dividend Yield: 0.1%.<BR><BR>Total Returns by Period:<BR>In the last 3 months, the price return was -7.05%, the dividend return was 0.11%, resulting in a total return of -6.94%.<BR><BR>In the last 6 months, the price return was -4.5%, the dividend return was 0.12%, leading to a total return of -4.38%.<BR><BR>Over the past year, the price return was -15.29%, with a dividend return of 0.11%, culminating in a total return of -15.18%.<BR><BR>In the last 2 years, the price return was 25.8%, the dividend return was 0.38%, resulting in a total return of 26.18%.<BR><BR>In the last 3 years, the price return was 147.56%, with a dividend return of 0.73%, leading to a total return of 148.29%.<BR><BR>Over the past 4 years, the price return was 225.83%, the dividend return was 1.49%, resulting in a total return of 227.32%.<BR><BR>In the last 5 years, the price return was 644.05%, with a dividend return of 3.88%, culminating in a total return of 647.93%.<BR><BR>Overall, KEI Industries Ltd has declared a significant dividend, and while recent total returns have been mixed, the longer-term performance shows substantial growth, particularly over the 5-year period.

View full answer

Is KEI Industries technically bullish or bearish?

10-Nov-2025

As of November 7, 2025, KEI Industries shows a mildly bullish trend on daily charts, but caution is advised due to mixed signals from weekly and monthly indicators.

As of 7 November 2025, the technical trend for KEI Industries has changed from sideways to mildly bullish. The current technical stance is mildly bullish, driven primarily by the daily moving averages indicating a bullish signal. However, the weekly and monthly MACD and KST are both mildly bearish, suggesting some caution in the longer time frames. The Dow Theory shows a mixed picture with a mildly bearish weekly stance and a mildly bullish monthly stance. Overall, while there are bullish signals on the daily chart, the bearish indicators on the weekly and monthly charts indicate a lack of strong conviction in the bullish trend.

View full answer

How has been the historical performance of KEI Industries?

28-Oct-2025

KEI Industries has shown consistent growth in net sales and profitability, with net sales increasing from 4,230.98 Cr in March 2019 to 9,735.88 Cr in March 2025, and profit after tax rising from 180.75 Cr to 696.41 Cr during the same period. Despite this growth, cash flow from operating activities has been volatile, with a negative cash flow of -32.00 Cr in March 2025.

Answer:<BR>The historical performance of KEI Industries shows a consistent growth trajectory in net sales and profitability over the years.<BR><BR>Breakdown:<BR>KEI Industries has demonstrated significant growth in net sales, increasing from 4,230.98 Cr in March 2019 to 9,735.88 Cr in March 2025. This upward trend is mirrored in total operating income, which rose from 4,230.98 Cr in March 2019 to 9,735.88 Cr in March 2025. The company's operating profit (PBDIT) also improved, reaching 1,062.77 Cr in March 2025, up from 447.74 Cr in March 2019. Profit before tax followed a similar pattern, climbing from 278.19 Cr in March 2019 to 936.97 Cr in March 2025, while profit after tax increased from 180.75 Cr to 696.41 Cr in the same period. The company's total assets grew from 3,268.88 Cr in March 2020 to 7,234.60 Cr in March 2025, indicating a solid expansion in its financial base. Additionally, the book value per share rose significantly from 168.39 in March 2020 to 605.49 in March 2025, reflecting enhanced shareholder value. However, cash flow from operating activities showed volatility, with a negative cash flow of -32.00 Cr in March 2025, contrasting with positive cash flows in previous years. Overall, KEI Industries has shown robust growth in sales and profits, alongside a solid increase in assets, despite fluctuations in cash flow from operations.

View full answer

Is KEI Industries overvalued or undervalued?

17-Oct-2025

As of October 16, 2025, KEI Industries is considered expensive and overvalued with a high PE ratio of 50.46, despite a strong historical return of 190.21% over three years, as recent performance has declined by 6.07% year-to-date compared to the Sensex's gain of 6.82%.

As of 16 October 2025, the valuation grade for KEI Industries has moved from very expensive to expensive. The company is currently considered overvalued based on its high PE ratio of 50.46, an EV to EBITDA of 24.38, and a PEG ratio of 2.58. In comparison to peers, Polycab India is categorized as very expensive with a PE of 51.46, while Havells India is rated fair with a significantly higher PE of 65.35, indicating that KEI Industries is trading at a premium relative to some of its competitors.<BR><BR>Despite the high valuation metrics, KEI Industries has shown a notable return of 190.21% over the past three years, which outpaces the Sensex's 44.11% return in the same period. However, the recent performance has been lackluster, with a year-to-date decline of 6.07% compared to the Sensex's gain of 6.82%. This suggests that while the company has had strong historical performance, its current valuation may not be justified given the recent trends and peer comparisons.

View full answer

Who are the top shareholders of the KEI Industries?

17-Jul-2025

The top shareholders of KEI Industries include promoters, with Anil Gupta holding 11.4%, institutional investors owning 47.02% (21.19% by mutual funds and 25.83% by foreign institutional investors), and individual shareholders with 12.65%. This diverse ownership indicates strong interest from both domestic and foreign investors.

The top shareholders of KEI Industries include a mix of promoters, institutional investors, and individual shareholders. The majority of the shares are held by promoters, with Anil Gupta being the promoter with the highest holding at 11.4%. <BR><BR>In terms of institutional investments, mutual funds hold 21.19% of the shares across 32 schemes, while foreign institutional investors (FIIs) account for 25.83% with 330 FIIs involved. The highest public shareholder is Kotak Mahindra Trustee Co Ltd, which holds 3.42% through the Kotak Nifty Midcap 150 Index Fund. Additionally, individual investors collectively own 12.65% of the company. <BR><BR>This diverse ownership structure reflects a strong interest from both domestic and foreign investors in KEI Industries.

View full answer
iScoreScore
Click here to find our call on this stock
Strong Sell
Sell
Hold
Buy
Strong Buy

Dashboard

1

Low Debt Company with Strong Long Term Fundamental Strength

  • Healthy long term growth as Net Sales has grown by an annual rate of 22.61% and Operating profit at 23.78%
  • The company is Net-Debt Free
  • The company has been able to generate a Return on Capital Employed (avg) of 25.30% signifying high profitability per unit of total capital (equity and debt)
2

The company has declared Positive results for the last 6 consecutive quarters

3

High Institutional Holdings at 53.22%

stock-summaryMojo Parameters

Mojo Parameters

Loading Valuation Snapshot...

Stock DNA

stock-summary
Industry

Cables - Electricals

stock-summary
Market cap

INR 50,023 Cr (Mid Cap)

stock-summary
P/E

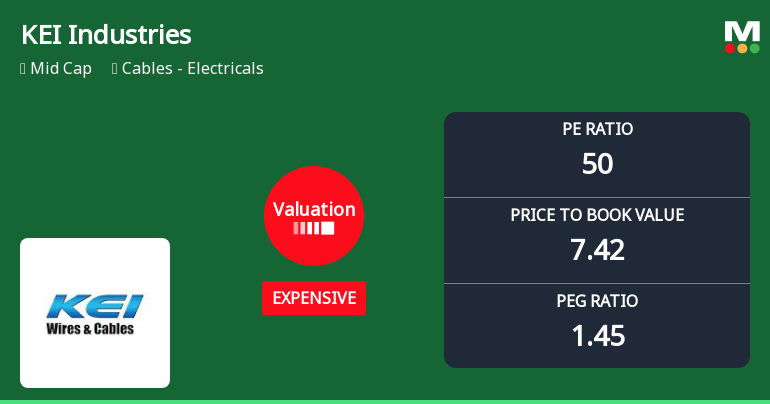
50.00

stock-summary
Industry P/E

53

stock-summary
Dividend Yield

0.09%

stock-summary
Debt Equity

-0.19

stock-summary
Return on Equity

13.78%

stock-summary
Price to Book

7.42

Revenue and Profits:
Net Sales:
3,185 Cr
(Quarterly Results - Jun 2026)
Net Profit:
274 Cr
stock-summaryTotal Returns
Total Returns (Price + Dividend) stock-summary
Dividend Yield (0.09%)
TimePeriod
Price Return
Dividend Return
Total Return
3 Months
0.2%
0%
0.2%
6 Months
0.51%
0%
0.51%
1 Year
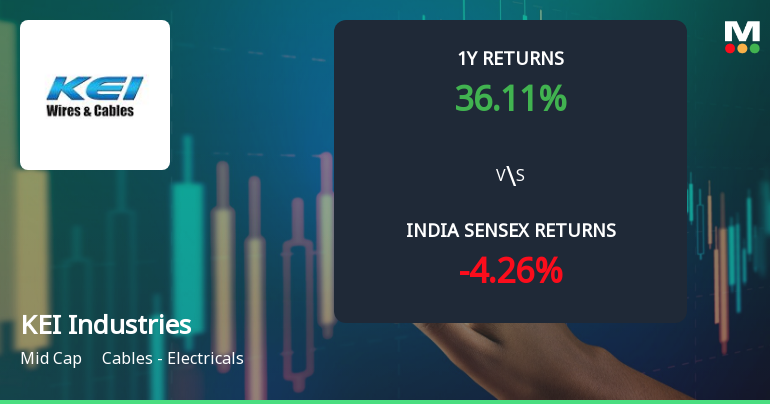
30.12%
0.11%
30.23%
2 Years
17.38%
0.19%
17.57%
3 Years
95.14%
0.46%
95.6%
4 Years
262.31%
1.07%
263.38%
5 Years
571.13%
1.91%
573.04%

Latest dividend: 4.5 per share ex-dividend date: Jan-28-2026

Risk Adjusted Returns v/s stock-summary
Returns Beta
Icon
Beta has not been calculated since enough price history is not available
stock-summaryNews & Corporate Actions

Announcements stock-summary

KEI Industries Limited - Outcome of Board Meeting

05-Dec-2019 | Source : NSE

KEI Industries Limited has informed the Exchange regarding Board meeting held on December 05, 2019.

KEI Industries Limited - Outcome of Board Meeting

13-Nov-2019 | Source : NSE

KEI Industries Limited has informed the Exchange regarding Board meeting held on November 12, 2019.

KEI Industries Limited - Updates

08-Nov-2019 | Source : NSE

KEI Industries Limited has informed the Exchange regarding 'Intimation under Regulation 29 of SEBI (Listing Obligations and Disclosure Requirements) Regulations, 2015 - update on Agenda to be considered at Board Meeting to be held on 12th November, 2019.

Corporate Actions stock-summary

stock-summary
BOARD MEETING

No Upcoming Board Meetings

stock-summary
DIVIDEND

KEI Industries Ltd has declared 225% dividend, ex-date: 28 Jan 26

stock-summary
SPLITS

KEI Industries Ltd has announced 2:10 stock split, ex-date: 21 Dec 06

stock-summary
BONUS

No Bonus history available

stock-summary
RIGHTS

No Rights history available

stock-summaryKey Factors

Quality key factors stock-summary

Factor
Value
Sales Growth (5y)
22.61%
EBIT Growth (5y)
23.78%
EBIT to Interest (avg)
17.28
Debt to EBITDA (avg)
0.32
Net Debt to Equity (avg)
-0.19
Sales to Capital Employed (avg)
2.17
Tax Ratio
25.51%
Dividend Payout Ratio
5.49%
Pledged Shares
0
Institutional Holding
53.22%
ROCE (avg)
24.60%
ROE (avg)
16.06%

Valuation key factors

Factor
Value
P/E Ratio
50
Industry P/E
53
Price to Book Value
7.42
EV to EBIT
38.01
EV to EBITDA
35.24
EV to Capital Employed
8.91
EV to Sales
3.90
PEG Ratio
1.45
Dividend Yield
0.09%
ROCE (Latest)
21.05%
ROE (Latest)
13.78%

Technicals key factors

Indicator
Weekly
Monthly
MACD
Mildly Bearish
Bullish
RSI
No Signal
No Signal
Bollinger Bands
Bearish
Mildly Bullish
Moving Averages
Mildly Bullish (Daily)
KST
Mildly Bearish
Bullish
Dow Theory
Mildly Bearish
No Trend
OBV
Mildly Bearish
No Trend
stock-summary Technical Indicator Scale: Bearish, Mildly Bearish, Sideways, Mildly Bullish, Bullish  Turned 
stock-summaryShareholding
Shareholding Snapshot : Jun 2026stock-summary
Shareholding Compare (%holding) stock-summary
Majority shareholders

Promoters

Pledged Promoter Holdings

None

Mutual Funds

Held by 35 Schemes (22.52%)

FIIs

Held by 336 FIIs (27.32%)

Promoter with highest holding

Anil Gupta (11.39%)

Highest Public shareholder

Motilal Oswal Nifty Midcap 150 Momentum 50 Etf (4.48%)

Individual Investors Holdings

9.8%

stock-summaryFinancial
[
  {
    "link": "quarterly",
    "btn_text": "All Quarterly Results",
    "header": "Quarterly Results Snapshot (Consolidated) - Jun'26 - YoY",
    "rhs": [
      {
        "prefix": "Net Sales ",
        "suffix": "YoY Growth in quarter ended Jun 2026 is 22.97% vs 25.44% in Jun 2025",
        "dir": -1
      },
      {
        "prefix": "Consolidated Net Profit ",
        "suffix": "YoY Growth in quarter ended Jun 2026 is 40.05% vs 30.28% in Jun 2025",
        "dir": 1
      }
    ],
    "table": {
      "header": [
        "Jun'26",
        "Jun'25",
        "Change(%)"
      ],
      "body": [
        {
          "field": "Net Sales",
          "val1": "3,185.34",
          "val2": "2,590.32",
          "chgp": "22.97%",
          "chgp_class": "positive"
        },
        {
          "field": "Operating Profit (PBDIT) excl Other Income",
          "val1": "395.84",
          "val2": "258.01",
          "chgp": "53.42%",
          "chgp_class": "positive"
        },
        {
          "field": "Interest",
          "val1": "17.68",
          "val2": "14.50",
          "chgp": "21.93%",
          "chgp_class": "negative"
        },
        {
          "field": "Exceptional Items",
          "val1": "0.00",
          "val2": "0.00",
          "chgp": "",
          "chgp_class": "neutral"
        },
        {
          "field": "Consolidate Net Profit",
          "val1": "274.14",
          "val2": "195.75",
          "chgp": "40.05%",
          "chgp_class": "positive"
        },
        {
          "field": "Operating Profit Margin (Excl OI)",
          "val1": "12.43%",
          "val2": "9.96%",
          "chgp": "2.47%",
          "chgp_class": "positive"
        }
      ]
    }
  },
  {
    "link": "half-yearly",
    "btn_text": "All Half Yearly Results",
    "header": "Half Yearly Results Snapshot (Consolidated) - Sep'25",
    "rhs": [
      {
        "prefix": "Net Sales ",
        "suffix": " Growth in half year ended Sep 2025 is 22.25% vs 16.73% in Sep 2024",
        "dir": 1
      },
      {
        "prefix": "Consolidated Net Profit ",
        "suffix": " Growth in half year ended Sep 2025 is 30.88% vs 16.62% in Sep 2024",
        "dir": 1
      }
    ],
    "table": {
      "header": [
        "Sep'25",
        "Sep'24",
        "Change(%)"
      ],
      "body": [
        {
          "field": "Net Sales",
          "val1": "5,316.67",
          "val2": "4,348.84",
          "chgp": "22.25%",
          "chgp_class": "positive"
        },
        {
          "field": "Operating Profit (PBDIT) excl Other Income",
          "val1": "527.36",
          "val2": "443.85",
          "chgp": "18.81%",
          "chgp_class": "positive"
        },
        {
          "field": "Interest",
          "val1": "28.66",
          "val2": "27.49",
          "chgp": "4.26%",
          "chgp_class": "negative"
        },
        {
          "field": "Exceptional Items",
          "val1": "0.00",
          "val2": "0.00",
          "chgp": "",
          "chgp_class": "neutral"
        },
        {
          "field": "Consolidate Net Profit",
          "val1": "399.26",
          "val2": "305.06",
          "chgp": "30.88%",
          "chgp_class": "positive"
        },
        {
          "field": "Operating Profit Margin (Excl OI)",
          "val1": "9.92%",
          "val2": "10.21%",
          "chgp": "-0.29%",
          "chgp_class": "negative"
        }
      ]
    }
  },
  {
    "link": "nine-monthly",
    "btn_text": "All Nine Monthly Results",
    "header": "Nine Monthly Results Snapshot (Consolidated) - Dec'25",
    "rhs": [
      {
        "prefix": "Net Sales ",
        "suffix": "YoY Growth in nine months ended Dec 2025 is 21.26% vs 17.91% in Dec 2024",
        "dir": 1
      },
      {
        "prefix": "Consolidated Net Profit ",
        "suffix": "YoY Growth in nine months ended Dec 2025 is 34.96% vs 13.97% in Dec 2024",
        "dir": 1
      }
    ],
    "table": {
      "header": [
        "Dec'25",
        "Dec'24",
        "Change(%)"
      ],
      "body": [
        {
          "field": "Net Sales",
          "val1": "8,271.37",
          "val2": "6,821.09",
          "chgp": "21.26%",
          "chgp_class": "positive"
        },
        {
          "field": "Operating Profit (PBDIT) excl Other Income",
          "val1": "847.45",
          "val2": "689.68",
          "chgp": "22.88%",
          "chgp_class": "positive"
        },
        {
          "field": "Interest",
          "val1": "45.29",
          "val2": "41.77",
          "chgp": "8.43%",
          "chgp_class": "negative"
        },
        {
          "field": "Exceptional Items",
          "val1": "0.00",
          "val2": "0.00",
          "chgp": "",
          "chgp_class": "neutral"
        },
        {
          "field": "Consolidate Net Profit",
          "val1": "634.12",
          "val2": "469.87",
          "chgp": "34.96%",
          "chgp_class": "positive"
        },
        {
          "field": "Operating Profit Margin (Excl OI)",
          "val1": "10.25%",
          "val2": "10.11%",
          "chgp": "0.14%",
          "chgp_class": "positive"
        }
      ]
    }
  },
  {
    "link": "annual",
    "btn_text": "All Annual Results",
    "header": "Annual Results Snapshot (Consolidated) - Mar'26",
    "rhs": [
      {
        "prefix": "Net Sales ",
        "suffix": "YoY Growth in year ended Mar 2026 is 20.66% vs 19.89% in Mar 2025",
        "dir": 1
      },
      {
        "prefix": "Consolidated Net Profit ",
        "suffix": "YoY Growth in year ended Mar 2026 is 31.88% vs 19.92% in Mar 2025",
        "dir": 1
      }
    ],
    "table": {
      "header": [
        "Mar'26",
        "Mar'25",
        "Change(%)"
      ],
      "body": [
        {
          "field": "Net Sales",
          "val1": "11,747.77",
          "val2": "9,735.88",
          "chgp": "20.66%",
          "chgp_class": "positive"
        },
        {
          "field": "Operating Profit (PBDIT) excl Other Income",
          "val1": "1,229.05",
          "val2": "990.97",
          "chgp": "24.02%",
          "chgp_class": "positive"
        },
        {
          "field": "Interest",
          "val1": "64.11",
          "val2": "55.65",
          "chgp": "15.20%",
          "chgp_class": "negative"
        },
        {
          "field": "Exceptional Items",
          "val1": "0.00",
          "val2": "0.00",
          "chgp": "",
          "chgp_class": "neutral"
        },
        {
          "field": "Consolidate Net Profit",
          "val1": "918.43",
          "val2": "696.41",
          "chgp": "31.88%",
          "chgp_class": "positive"
        },
        {
          "field": "Operating Profit Margin (Excl OI)",
          "val1": "10.46%",
          "val2": "10.18%",
          "chgp": "0.28%",
          "chgp_class": "positive"
        }
      ]
    }
  }
]

Quarterly Results Snapshot (Consolidated) - Jun'26 - YoYstock-summary

Jun'26
Jun'25
Change(%)
Net Sales
3,185.34
2,590.32
22.97%
Operating Profit (PBDIT) excl Other Income
395.84
258.01
53.42%
Interest
17.68
14.50
21.93%
Exceptional Items
0.00
0.00
Consolidate Net Profit
274.14
195.75
40.05%
Operating Profit Margin (Excl OI)
12.43%
9.96%
2.47%
Values in Rs Cr.
Direction Arrows
Net Sales

YoY Growth in quarter ended Jun 2026 is 22.97% vs 25.44% in Jun 2025

Direction Arrows
Consolidated Net Profit

YoY Growth in quarter ended Jun 2026 is 40.05% vs 30.28% in Jun 2025

Half Yearly Results Snapshot (Consolidated) - Sep'25stock-summary

Sep'25
Sep'24
Change(%)
Net Sales
5,316.67
4,348.84
22.25%
Operating Profit (PBDIT) excl Other Income
527.36
443.85
18.81%
Interest
28.66
27.49
4.26%
Exceptional Items
0.00
0.00
Consolidate Net Profit
399.26
305.06
30.88%
Operating Profit Margin (Excl OI)
9.92%
10.21%
-0.29%
Values in Rs Cr.
Direction Arrows
Net Sales

Growth in half year ended Sep 2025 is 22.25% vs 16.73% in Sep 2024

Direction Arrows
Consolidated Net Profit

Growth in half year ended Sep 2025 is 30.88% vs 16.62% in Sep 2024

Nine Monthly Results Snapshot (Consolidated) - Dec'25stock-summary

Dec'25
Dec'24
Change(%)
Net Sales
8,271.37
6,821.09
21.26%
Operating Profit (PBDIT) excl Other Income
847.45
689.68
22.88%
Interest
45.29
41.77
8.43%
Exceptional Items
0.00
0.00
Consolidate Net Profit
634.12
469.87
34.96%
Operating Profit Margin (Excl OI)
10.25%
10.11%
0.14%
Values in Rs Cr.
Direction Arrows
Net Sales

YoY Growth in nine months ended Dec 2025 is 21.26% vs 17.91% in Dec 2024

Direction Arrows
Consolidated Net Profit

YoY Growth in nine months ended Dec 2025 is 34.96% vs 13.97% in Dec 2024

Annual Results Snapshot (Consolidated) - Mar'26stock-summary

Mar'26
Mar'25
Change(%)
Net Sales
11,747.77
9,735.88
20.66%
Operating Profit (PBDIT) excl Other Income
1,229.05
990.97
24.02%
Interest
64.11
55.65
15.20%
Exceptional Items
0.00
0.00
Consolidate Net Profit
918.43
696.41
31.88%
Operating Profit Margin (Excl OI)
10.46%
10.18%
0.28%
Values in Rs Cr.
Direction Arrows
Net Sales

YoY Growth in year ended Mar 2026 is 20.66% vs 19.89% in Mar 2025

Direction Arrows
Consolidated Net Profit

YoY Growth in year ended Mar 2026 is 31.88% vs 19.92% in Mar 2025

stock-summaryCompany CV
About KEI Industries Ltd stock-summary
stock-summary
KEI Industries Ltd
Mid Cap
Cables - Electricals
KEI Industries Limited commenced business as a Partnership Firm under the name of "Krishna Electrical Industries" established in 1968. The Firm was converted into a Public Limited Company on 31st December, 1992. The Company is India's leading manufacturer of wire and cable solutions, serving clients across sectors and the globe.
Company Coordinates stock-summary
Company Details
D-90 Okhla Industrial Area, Phase-I New Delhi New Delhi : 110020
stock-summary
Tel: 91-11-26818840/8642
stock-summary
cs@kei-ind.com
Registrar Details
MAS Services Ltd, T-34 , 2nd Floor, Okhla Industrial Area, Phase - II, New Delhi