
Compare KEI Industries with Similar Stocks
Dashboard
Low Debt Company with Strong Long Term Fundamental Strength
- Healthy long term growth as Net Sales has grown by an annual rate of 22.95% and Operating profit at 23.39%
- The company is Net-Debt Free
- The company has been able to generate a Return on Capital Employed (avg) of 25.30% signifying high profitability per unit of total capital (equity and debt)
The company has declared Positive results for the last 5 consecutive quarters
High Institutional Holdings at 53.1%
Market Beating performance in long term as well as near term
Stock DNA
Cables - Electricals
INR 47,410 Cr (Mid Cap)
52.00
45
0.09%
-0.19
13.78%
7.07
Total Returns (Price + Dividend) 
Latest dividend: 4.500116006290118 per share ex-dividend date: Jan-28-2026
Risk Adjusted Returns v/s
Returns Beta

News
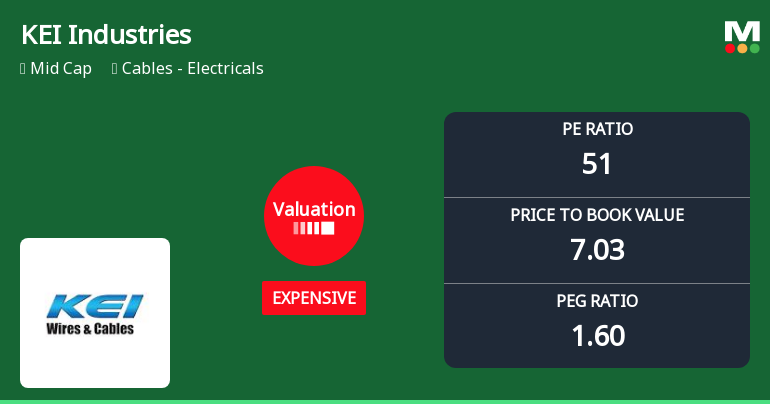
KEI Industries Ltd Valuation Adjusts Amid Price Correction and Market Dynamics
KEI Industries Ltd, a prominent player in the cables and electricals sector, has experienced a notable shift in its valuation parameters, moving from a very expensive to an expensive rating. This change reflects evolving market perceptions amid fluctuating price-to-earnings and price-to-book value ratios, prompting investors to reassess the stock’s price attractiveness relative to its historical and peer benchmarks.
Read full news article
KEI Industries Ltd is Rated Buy by MarketsMOJO
KEI Industries Ltd is rated 'Buy' by MarketsMOJO, with this rating last updated on 18 May 2026. However, the analysis and financial metrics discussed here reflect the stock's current position as of 13 July 2026, providing investors with the latest insights into its performance and outlook.
Read full news article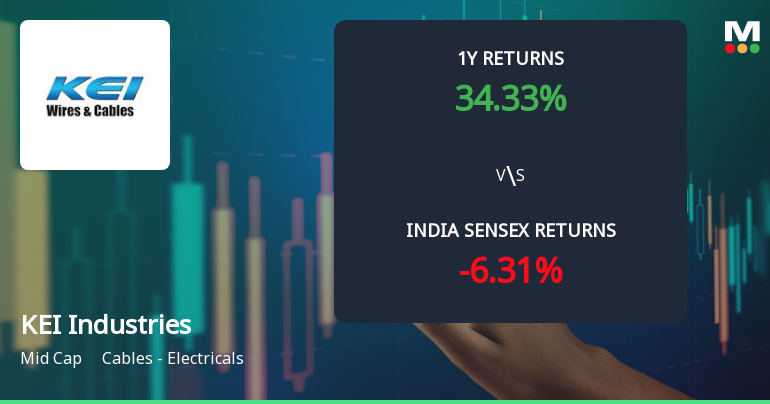
KEI Industries Ltd Sees Technical Momentum Shift Amid Mixed Market Signals
KEI Industries Ltd, a prominent player in the Cables - Electricals sector, has experienced a notable shift in its technical momentum, transitioning from a bullish to a mildly bullish stance. Despite a recent decline in share price, the stock continues to demonstrate resilience with a strong year-to-date return of 14.4%, outperforming the Sensex by over 22 percentage points. This article analyses the latest technical indicators, price movements, and market context to provide a comprehensive outlook for investors.
Read full news article Announcements
KEI Industries Limited - Outcome of Board Meeting
05-Dec-2019 | Source : NSEKEI Industries Limited has informed the Exchange regarding Board meeting held on December 05, 2019.
KEI Industries Limited - Outcome of Board Meeting
13-Nov-2019 | Source : NSEKEI Industries Limited has informed the Exchange regarding Board meeting held on November 12, 2019.
KEI Industries Limited - Updates
08-Nov-2019 | Source : NSEKEI Industries Limited has informed the Exchange regarding 'Intimation under Regulation 29 of SEBI (Listing Obligations and Disclosure Requirements) Regulations, 2015 - update on Agenda to be considered at Board Meeting to be held on 12th November, 2019.
Corporate Actions

No Upcoming Board Meetings

KEI Industries Ltd has declared 225% dividend, ex-date: 28 Jan 26

KEI Industries Ltd has announced 2:10 stock split, ex-date: 21 Dec 06

No Bonus history available

No Rights history available
Quality key factors
Valuation key factors
Technicals key factors
 Technical Indicator Scale: Bearish, Mildly Bearish, Sideways, Mildly Bullish, Bullish Turned
 Shareholding Snapshot : Mar 2026
Shareholding Compare (%holding)
Promoters
None
Held by 35 Schemes (22.43%)
Held by 338 FIIs (27.27%)
Anil Gupta (11.39%)
Motilal Oswal Bse 1000 Index Fund (4.56%)
9.73%
Quarterly Results Snapshot (Consolidated) - Mar'26 - YoY

YoY Growth in quarter ended Mar 2026 is 19.27% vs 25.11% in Mar 2025
YoY Growth in quarter ended Mar 2026 is 25.50% vs 34.46% in Mar 2025
Half Yearly Results Snapshot (Consolidated) - Sep'25

Growth in half year ended Sep 2025 is 22.25% vs 16.73% in Sep 2024
Growth in half year ended Sep 2025 is 30.88% vs 16.62% in Sep 2024
Nine Monthly Results Snapshot (Consolidated) - Dec'25
YoY Growth in nine months ended Dec 2025 is 21.26% vs 17.91% in Dec 2024
YoY Growth in nine months ended Dec 2025 is 34.96% vs 13.97% in Dec 2024
Annual Results Snapshot (Consolidated) - Mar'26
YoY Growth in year ended Mar 2026 is 20.66% vs 19.89% in Mar 2025
YoY Growth in year ended Mar 2026 is 31.88% vs 19.92% in Mar 2025
About KEI Industries Ltd

Company Coordinates


