
Compare Centum Electron with Similar Stocks
Dashboard
Company's ability to service its debt is weak with a poor EBIT to Interest (avg) ratio of 1.82
- Company's ability to service its debt is weak with a poor EBIT to Interest (avg) ratio of 1.82
- The company has been able to generate a Return on Equity (avg) of 7.11% signifying low profitability per unit of shareholders funds
Poor long term growth as Net Sales has grown by an annual rate of 6.65% and Operating profit at 17.30% over the last 5 years
With a growth in Net Sales of 27.46%, the company declared Very Positive results in Mar 26
With ROE of 20.5, it has a Very Expensive valuation with a 15.4 Price to Book Value
Stock DNA
Industrial Manufacturing
INR 5,201 Cr (Small Cap)
75.00
56
0.00%
0.01
20.50%
15.37
Total Returns (Price + Dividend) 
Latest dividend: 6 per share ex-dividend date: Jul-25-2025
Risk Adjusted Returns v/s
Returns Beta

News

Centum Electronics Ltd Technical Momentum Shifts Signal Bullish Outlook Amid Mixed Indicators
Centum Electronics Ltd, a small-cap player in the industrial manufacturing sector, has experienced a notable shift in its technical momentum, moving from a mildly bullish stance to a more confident bullish trend. Despite some mixed signals from key indicators such as RSI and OBV, the overall technical landscape suggests improving price momentum and potential for further gains.
Read full news article
Centum Electronics Ltd Downgraded to Hold Amid Mixed Technical and Financial Signals
Centum Electronics Ltd, a small-cap player in the industrial manufacturing sector, has seen its investment rating downgraded from Buy to Hold as of 27 July 2026. This adjustment reflects a nuanced reassessment across four key parameters: quality, valuation, financial trend, and technical indicators. Despite strong recent financial performance and impressive long-term returns, evolving technical signals and valuation concerns have tempered the outlook, prompting a more cautious stance.
Read full news article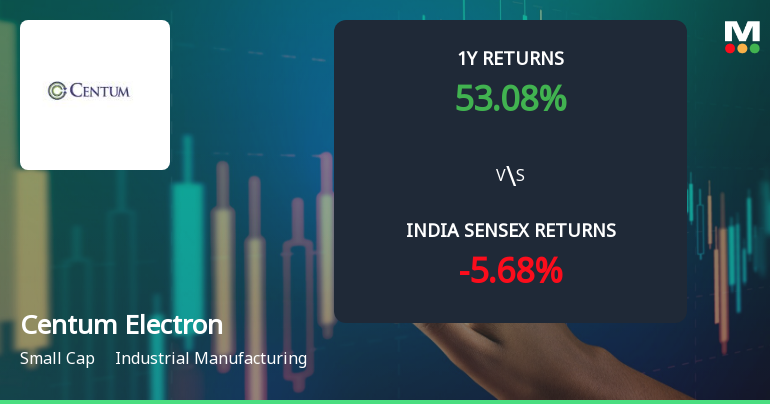
Centum Electronics Ltd Sees Technical Momentum Shift Amid Mixed Indicator Signals
Centum Electronics Ltd, a small-cap player in the industrial manufacturing sector, has experienced a notable shift in its technical momentum, reflecting a nuanced market sentiment. Despite a recent downgrade from a Buy to a Hold rating by MarketsMOJO, the stock continues to demonstrate strong long-term returns, though short-term indicators suggest caution for investors.
Read full news article Announcements
Centum Electronics Limited - Registrar & Share Transfer Agent Update
09-Dec-2019 | Source : NSECentum Electronics Limited has informed the Exchange regarding the Registrar & Share Transfer Agent Update
Centum Electronics Limited - Updates
14-Nov-2019 | Source : NSECentum Electronics Limited has informed the Exchange regarding 'Publication of Unaudited Consolidated Financial Results'.
Centum Electronics Limited - Outcome of Board Meeting
13-Nov-2019 | Source : NSECentum Electronics Limited has informed the Exchange regarding Board meeting held on November 12, 2019.
Corporate Actions

No Upcoming Board Meetings

Centum Electronics Ltd has declared 50% dividend, ex-date: 31 Jul 26

No Splits history available

No Bonus history available

No Rights history available
Quality key factors
Valuation key factors
Technicals key factors
 Technical Indicator Scale: Bearish, Mildly Bearish, Sideways, Mildly Bullish, Bullish Turned
 Shareholding Snapshot : Jun 2026
Shareholding Compare (%holding)
Promoters
None
Held by 3 Schemes (9.6%)
Held by 38 FIIs (3.31%)
Apparao Venkata Mallavarapu (35.45%)
Hdfc Trustee Company Limited - Hdfc Infrastructure (8.97%)
21.41%
Quarterly Results Snapshot (Consolidated) - Mar'26 - YoY

YoY Growth in quarter ended Mar 2026 is 27.46% vs -10.04% in Mar 2025

YoY Growth in quarter ended Mar 2026 is -92.38% vs 412.03% in Mar 2025
Half Yearly Results Snapshot (Consolidated) - Sep'25
Growth in half year ended Sep 2025 is 11.61% vs 1.94% in Sep 2024
Growth in half year ended Sep 2025 is 309.38% vs -33.76% in Sep 2024
Nine Monthly Results Snapshot (Consolidated) - Dec'25
YoY Growth in nine months ended Dec 2025 is 2.91% vs -1.96% in Dec 2024
YoY Growth in nine months ended Dec 2025 is -127.37% vs -666.67% in Dec 2024
Annual Results Snapshot (Consolidated) - Mar'26
YoY Growth in year ended Mar 2026 is 28.70% vs -32.14% in Mar 2025
YoY Growth in year ended Mar 2026 is -2,584.46% vs 30.07% in Mar 2025
About Centum Electronics Ltd

Company Coordinates


