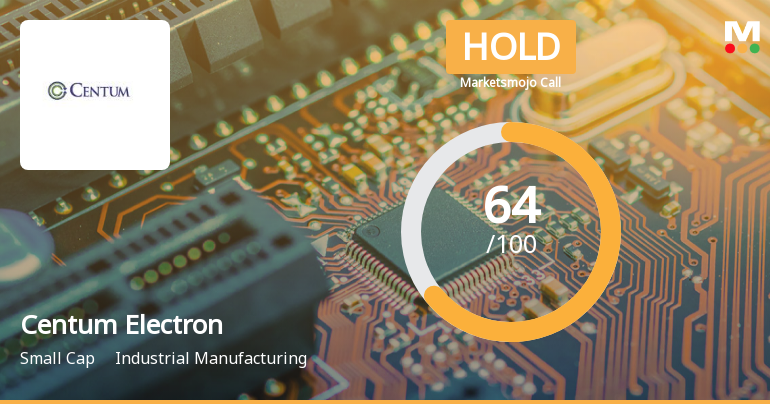
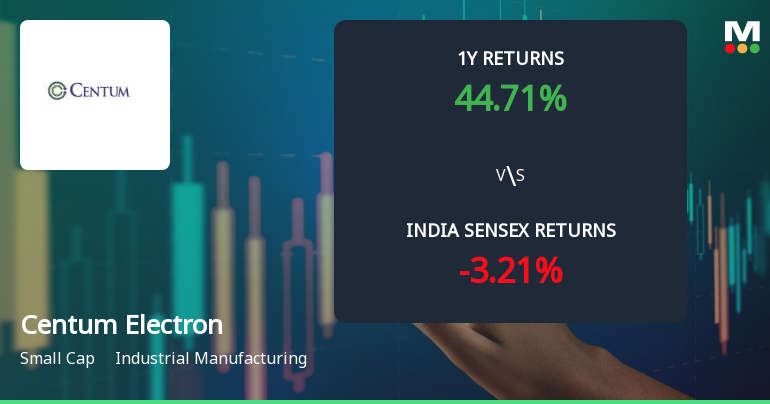
Centum Electron

  • Market Cap: Small Cap
  • Industry: Industrial Manufacturing
  • ISIN: INE320B01020
  • NSEID: CENTUM
  • BSEID: 517544
INR
3,274.80
-84.7 (-2.52%)
BSENSE

Aug 25, 03:58 PM

BSE+NSE Vol: 37.44 k

  • Price Points
  • Score
  • Mojo Parameters
  • Total Return
  • News and Corporate Actions
  • Key factors
  • Shareholding
  • Financials
  • CompanyCV
stock-summaryPrice Point
High/Low

1Day

52 Week

Valuation
Technical
Day's Volume

CASH

37.44 k (-51.81%) Volume

Shareholding (Jun 2026)

FII

3.31%

Held by 38 FIIs

DII

19.67%

Held by 10 DIIs

Promoter

46.82%

Why is Centum Electronics Ltd falling/rising?

25-Aug-2026

As of 24-Aug, Centum Electronics Ltd's stock price is currently Rs 3,360.35, reflecting a 2.3% decline and underperforming its sector. Despite a strong year-to-date increase of 43.42%, recent short-term challenges and decreased investor participation have contributed to the stock's current drop.

As of 24-Aug, Centum Electronics Ltd's stock price is falling, currently at Rs 3,360.35, which reflects a decrease of Rs 79.1 or 2.3%. This decline is part of a broader trend, as the stock has been losing value for the last two days, with a total drop of 2.47% during this period. Additionally, the stock's performance today has underperformed its sector by 1.77%. <BR><BR>The stock has also touched an intraday low of Rs 3,351, indicating a significant drop of 2.57% at its lowest point. The trading volume has shown a concerning trend, with delivery volume on August 21 falling by 40.31% compared to the five-day average, suggesting a decrease in investor participation. <BR><BR>Despite these short-term challenges, it is noteworthy that Centum Electronics Ltd has demonstrated strong performance over the longer term, with a year-to-date increase of 43.42% and a remarkable 597.02% rise over the past five years. However, the recent underperformance in the short term, combined with falling investor participation, appears to be the primary reasons for the current decline in the stock price.

View full answer

Should I buy, sell or hold Centum Electronics Ltd?

15-Aug-2026

Who are in the management team of Centum Electron?

14-Aug-2026

The management team of Centum Electron includes Apparao V Mallavarapu (Chairman & Managing Director), Nikhil Mallavarapu (Whole-time Director), and several independent directors such as Manoj Nagrath and Rajiv C Mody, among others, bringing diverse expertise to the company.

The management team of Centum Electron includes the following individuals:<BR><BR>1. **Apparao V Mallavarapu** - Chairman & Managing Director<BR>2. **Nikhil Mallavarapu** - Whole-time Director<BR>3. **Manoj Nagrath** - Non-Executive & Independent Director<BR>4. **Rajiv C Mody** - Non-Executive & Independent Director<BR>5. **Pranav Kumar Patel** - Non-Executive & Independent Director<BR>6. **Thiruvengadam P** - Non-Executive & Independent Director<BR>7. **Kavitha Dutt Chitturi** - Independent Director<BR>8. **Indu H S** - Company Secretary & Compliance Officer<BR>9. **Tanya Mallavarapu** - Director<BR><BR>This team brings a diverse range of expertise and leadership to the company.

View full answer

What does Centum Electron do?

14-Aug-2026

Centum Electronics Ltd designs and manufactures advanced electronics systems in the Industrial Manufacturing sector. As of June 2026, it reported net sales of 204 Cr and a net profit of 106 Cr, with a market cap of INR 5,654 Cr.

Overview: <BR>Centum Electronics Ltd designs and manufactures advanced electronics systems, subsystems, and modules, operating within the Industrial Manufacturing sector as a Small Cap company.<BR><BR>History: <BR>Centum Electronics Limited was incorporated on January 8, 1993, originally named 'Solectron Centum Electronics Limited'. The company rebranded to its current name on December 3, 2007. The latest quarterly results reported net sales and net profit for June 2026.<BR><BR>Financial Snapshot: <BR>Net Sales: 204 Cr (Quarterly Results - Jun 2026) <BR>Net Profit: 106 Cr (Quarterly Results - Jun 2026) <BR>Market Cap: INR 5,654 Cr (Small Cap)<BR><BR>Key Metrics: <BR>P/E: 80.00 <BR>Industry P/E: 57 <BR>Dividend Yield: 0.13% <BR>Debt Equity: 0.01 <BR>Return on Equity: 20.50% <BR>Price to Book: 16.30<BR><BR>Contact Details: <BR>Address: No 44 KHB Industrial Area, Yelahanka New Township Bangalore Karnataka : 560106 <BR>Tel: 91-80-41436000 <BR>Email: investors@centumelectronics.com <BR>Website: http://www.centumelectronics.com

View full answer

Who are the peers of the Centum Electron?

14-Aug-2026

Centum Electron's peers include Elecon Engg.Co, Kennametal India, Dynamatic Tech., Standard Enginee, Praj Industries, Cyient DLM, DEE Development, John Cockerill, and Marine Electric. In terms of performance, John Cockerill leads with a 1-year return of 134.32%, while Centum Electron has a return of 53.33%.

Peers: The peers of Centum Electron are Elecon Engg.Co, Kennametal India, Dynamatic Tech., Standard Enginee, Praj Industries, Cyient DLM, DEE Development, John Cockerill, and Marine Electric.<BR><BR>Quality Snapshot: Excellent management risk is observed at Elecon Engg.Co, Kennametal India, and Praj Industries, while Average management risk is found at Dynamatic Tech., Standard Enginee, Centum Electron, Cyient DLM, John Cockerill, and Marine Electric. Below Average management risk is noted at DEE Development. Growth is Good for Kennametal India and Average for Dynamatic Tech., Cyient DLM, and John Cockerill, while Below Average growth is seen at Elecon Engg.Co, Standard Enginee, Praj Industries, Centum Electron, DEE Development, and Marine Electric. Excellent capital structure is present at Elecon Engg.Co, Kennametal India, Standard Enginee, and Praj Industries, while Below Average capital structure is noted for Dynamatic Tech., Centum Electron, DEE Development, and the rest.<BR><BR>Return Snapshot: The peer with the highest 1-year return is John Cockerill at 134.32%, while the lowest is Elecon Engg.Co at -21.90%. Centum Electron's 1-year return of 53.33% is higher than that of Elecon Engg.Co but lower than John Cockerill. Additionally, DEE Development and Marine Electric have negative six-month returns.

View full answer

How big is Centum Electron?

14-Aug-2026

As of 14th August, Centum Electronics Ltd has a market capitalization of 5,203.96 Cr, with recent Net Sales of 1,058.62 Cr and a Net Profit of 49.32 Cr.

As of 14th August, Centum Electronics Ltd has a market capitalization of 5,203.96 Cr, categorizing it as a Small Cap company.<BR><BR>In the latest four quarters, Centum Electronics reported Net Sales of 1,058.62 Cr and a Net Profit of 49.32 Cr.<BR><BR>The latest reporting period for the balance sheet is March 2026, with Shareholder's Funds amounting to 343.21 Cr and Total Assets totaling 1,283.29 Cr.

View full answer

Are Centum Electronics Ltd latest results good or bad?

15-May-2026

Centum Electronics Ltd's latest results show strong revenue growth with a record ₹340.43 crores in Q4 FY26, up 27.46% year-on-year; however, net profit plummeted 92.38% to ₹1.64 crores, raising concerns about profitability and overall performance.

Centum Electronics Ltd's latest results present a mixed picture. On one hand, the company achieved its highest-ever quarterly revenue of ₹340.43 crores in Q4 FY26, reflecting a robust year-on-year growth of 27.46%. This indicates strong demand and effective order execution in its key segments, including defence, space, and automotive electronics.<BR><BR>However, the net profit for the same quarter was only ₹1.64 crores, which represents a staggering decline of 92.38% compared to the previous year. This significant drop in profitability is concerning, especially given that the standalone profit was ₹35.00 crores, but consolidation adjustments severely impacted the overall group performance.<BR><BR>Additionally, while the operating margin improved slightly from the previous quarter to 14.37%, it is still down from 17.18% year-on-year, indicating challenges in maintaining profitability amid rising costs or competitive pressures.<BR><BR>In summary, while Centum Electronics has demonstrated impressive revenue growth, the drastic decline in net profit and ongoing issues with consolidated performance raise significant concerns for investors. The company is at a critical juncture where it must address these profitability challenges to sustain investor confidence.

View full answer

When is the next results date for Centum Electronics Ltd?

06-Feb-2026

The next results date for Centum Electronics Ltd is 14 February 2026.

The next results date for Centum Electronics Ltd is scheduled for 14 February 2026.

View full answer

How has been the historical performance of Centum Electron?

13-Nov-2025

Centum Electron has experienced steady sales growth from INR 779.94 crore in March 2022 to INR 1,155.41 crore in March 2025, but has faced profitability challenges, reporting a profit after tax of -1.93 crore and negative cash flow of -29.00 crore in March 2025. Total assets and liabilities increased significantly, indicating rising financial obligations.

Answer:<BR>The historical performance of Centum Electron shows a fluctuating trend in key financial metrics over the years, with notable changes in sales, profits, and overall financial health.<BR><BR>Breakdown:<BR>Centum Electron's net sales have shown a steady increase from INR 779.94 crore in March 2022 to INR 1,155.41 crore in March 2025, reflecting a positive growth trajectory. However, the total expenditure has also risen, reaching INR 1,058.71 crore in March 2025, which has impacted the operating profit, which stood at INR 105.41 crore for the same period. Despite the growth in sales and operating profit, the company reported a profit after tax of -1.93 crore in March 2025, continuing a trend of negative net profits since March 2022. The total assets of Centum Electron increased to INR 1,220.53 crore in March 2025, up from INR 919.80 crore in March 2022, while total liabilities also rose to INR 1,220.53 crore, indicating a significant increase in financial obligations. Cash flow from operating activities turned negative at -29.00 crore in March 2025, contrasting sharply with the positive cash flow of 201.00 crore in March 2024, highlighting challenges in cash generation. Overall, while Centum Electron has improved its sales and operating metrics, it continues to face profitability and cash flow challenges.

View full answer

How has been the historical performance of Centum Electron?

12-Nov-2025

Centum Electron's historical performance shows increasing net sales and operating income from Mar'22 to Mar'25, but profitability remains a challenge with negative net profits, despite improvements in operating profit and total assets. Cash flow from operating activities turned negative in Mar'25 after being positive in the previous year.

Answer:<BR>The historical performance of Centum Electron shows a fluctuating trend in key financial metrics over the years, with notable changes in revenue and profitability.<BR><BR>Breakdown:<BR>Centum Electron's net sales have increased from 779.94 Cr in Mar'22 to 1,155.41 Cr in Mar'25, reflecting a strong upward trend. Total operating income followed a similar trajectory, rising from 779.94 Cr in Mar'22 to 1,155.41 Cr in Mar'25. However, the company's total expenditure also increased, from 766.05 Cr in Mar'22 to 1,058.71 Cr in Mar'25, leading to an operating profit (PBDIT) of 105.41 Cr in Mar'25, up from 21.91 Cr in Mar'22. Despite this improvement, the profit before tax showed a modest increase to 13.60 Cr in Mar'25 from a loss of 47.63 Cr in Mar'22. The profit after tax remained negative at -1.93 Cr in Mar'25, although it improved from -48.90 Cr in Mar'22. The company's total assets grew from 919.80 Cr in Mar'22 to 1,220.53 Cr in Mar'25, while total liabilities also increased from 919.80 Cr to 1,220.53 Cr in the same period. Cash flow from operating activities turned negative at -29.00 Cr in Mar'25, contrasting with a positive cash flow of 201.00 Cr in Mar'24. Overall, while Centum Electron has shown growth in sales and operating income, profitability remains a challenge, with negative net profits in recent years.

View full answer

Is Centum Electron technically bullish or bearish?

03-Oct-2025

As of October 1, 2025, Centum Electron's technical trend is mildly bullish, supported by a bullish MACD and Bollinger Bands, although the KST shows some bearish signals on weekly and monthly time frames.

As of 1 October 2025, the technical trend for Centum Electron has changed from bullish to mildly bullish. The weekly MACD remains bullish, supported by bullish signals from the Bollinger Bands. However, the KST indicates a mildly bearish stance on the weekly and monthly time frames. The daily moving averages are bullish, but the Dow Theory shows no clear trend in both weekly and monthly assessments. Overall, the current technical stance is mildly bullish, with key indicators like MACD and Bollinger Bands supporting this view, despite some caution from the KST.

View full answer

Who are the top shareholders of the Centum Electron?

17-Jul-2025

The top shareholder of Centum Electron is Apparao Venkata Mallavarapu, owning 40.1% of the shares. Institutional investors, led by HDFC Mutual Fund with an 8.23% stake, collectively hold 8.64%, while individual investors account for 20.77% of the total shareholding.

The top shareholders of Centum Electron include a mix of promoters and institutional investors. The largest shareholder is Apparao Venkata Mallavarapu, who holds 40.1% of the shares. The company is primarily owned by its promoters, with no pledged promoter holdings reported. <BR><BR>In terms of institutional investors, HDFC Mutual Fund, specifically through the HDFC Multi Cap Fund, is the highest public shareholder with an 8.23% stake. Additionally, mutual funds collectively hold 8.64% through two schemes, while foreign institutional investors (FIIs) hold a smaller portion of 0.82%. Individual investors account for 20.77% of the total shareholding.

View full answer

Is Centum Electron overvalued or undervalued?

09-Jun-2025

As of August 25, 2023, Centum Electron is considered overvalued with a high PE ratio of 244.45 and expensive valuation metrics, despite a strong 42.87% return over the past year.

As of 25 August 2023, the valuation grade for Centum Electron has moved from very expensive to expensive, indicating a slight improvement in perceived value. However, the company remains overvalued based on its current metrics. The price-to-earnings (PE) ratio stands at an exceptionally high 244.45, while the price-to-book value is 8.54, and the EV to EBITDA ratio is 36.40, all suggesting that the stock is priced significantly above its fundamental value.<BR><BR>When compared to peers, Centum Electron's PE ratio is notably higher than Kaynes Tech at 125.17 and Honeywell Auto at 65.93, both of which are categorized as very expensive. Additionally, the PEG ratio of 0.50 indicates potential for growth relative to its price, but this is overshadowed by the high valuation multiples. Despite a strong performance over the past year with a return of 42.87% compared to the Sensex's 7.60%, the current valuation metrics suggest that Centum Electron is overvalued in the industrial manufacturing sector.

View full answer

Has Centum Electron declared dividend?

06-Jun-2025

Centum Electronics Ltd has declared a 30% dividend, amounting to ₹3 per share, with an ex-date of July 31, 2024. The company has shown strong total returns, including a 43.11% return over the last 6 months and 802.25% over the past 5 years.

Centum Electronics Ltd has declared a 30% dividend.<BR><BR>Dividend Details:<BR>- Percentage announced: 30%<BR>- Amount per share: 3 per share<BR>- Ex-date: Jul-31-2024<BR><BR>Dividend Yield: 0.11%.<BR><BR>Total Returns by Period:<BR>In the last 6 months, the price return was 43.11%, with a dividend return of 0%, resulting in a total return of 43.11%.<BR><BR>Over the past year, the price return was 45.54%, the dividend return was 0.18%, leading to a total return of 45.72%.<BR><BR>In the 2-year period, the price return reached 107.14%, with a dividend return of 0.77%, culminating in a total return of 107.91%.<BR><BR>For the 3-year period, the price return was an impressive 420.74%, while the dividend return was 3.05%, giving a total return of 423.79%.<BR><BR>In the last 4 years, the price return stood at 455.61%, with a dividend return of 3.66%, resulting in a total return of 459.27%.<BR><BR>Finally, over the past 5 years, the price return was 795.92%, and the dividend return was 6.33%, leading to a total return of 802.25%.<BR><BR>Overall, Centum Electronics Ltd has declared a significant dividend while also demonstrating strong total returns across various periods, indicating robust financial performance and shareholder value enhancement.

View full answer
iScoreScore
Part of MojoOne Strategy
Click here to find our call on this stock
Strong Sell
Sell
Hold
Buy
Strong Buy

Dashboard

1

Poor long term growth as Net Sales has grown by an annual rate of 5.71% over the last 5 years

 
2

The company has declared Positive results for the last 3 consecutive quarters

3

With ROE of 23.7, it has a Very Expensive valuation with a 14.5 Price to Book Value

4

High Institutional Holdings at 22.98%

5

Market Beating performance in long term as well as near term

stock-summaryMojo Parameters

Mojo Parameters

Loading Valuation Snapshot...

Stock DNA

stock-summary
Industry

Industrial Manufacturing

stock-summary
Market cap

INR 4,834 Cr (Small Cap)

stock-summary
P/E

47.00

stock-summary
Industry P/E

18

stock-summary
Dividend Yield

0.15%

stock-summary
Debt Equity

0.01

stock-summary
Return on Equity

23.66%

stock-summary
Price to Book

14.47

Revenue and Profits:
Net Sales:
204 Cr
(Quarterly Results - Jun 2026)
Net Profit:
106 Cr
stock-summaryTotal Returns
Total Returns (Price + Dividend) stock-summary
Dividend Yield (0.15%)
TimePeriod
Price Return
Dividend Return
Total Return
3 Months
3.24%
0.15%
3.39%
6 Months
21.99%
0.19%
22.18%
1 Year
17.28%
0.18%
17.46%
2 Years
109.73%
0.59%
110.32%
3 Years
88.83%
1.06%
89.89%
4 Years
653.09%
4.12%
657.21%
5 Years
581.4%
4.96%
586.36%

Latest dividend: 4.993943661971831 per share ex-dividend date: Jul-31-2026

Risk Adjusted Returns v/s stock-summary
Returns Beta
Icon
Beta has not been calculated since enough price history is not available
stock-summaryNews & Corporate Actions

News

Centum Electronics Drops 7.93%: 2 Key Events Shaping the Week

Announcements stock-summary

Centum Electronics Limited - Registrar & Share Transfer Agent Update

09-Dec-2019 | Source : NSE

Centum Electronics Limited has informed the Exchange regarding the Registrar & Share Transfer Agent Update

Centum Electronics Limited - Updates

14-Nov-2019 | Source : NSE

Centum Electronics Limited has informed the Exchange regarding 'Publication of Unaudited Consolidated Financial Results'.

Centum Electronics Limited - Outcome of Board Meeting

13-Nov-2019 | Source : NSE

Centum Electronics Limited has informed the Exchange regarding Board meeting held on November 12, 2019.

Corporate Actions stock-summary

stock-summary
BOARD MEETING

No Upcoming Board Meetings

stock-summary
DIVIDEND

Centum Electronics Ltd has declared 50% dividend, ex-date: 31 Jul 26

stock-summary
SPLITS

No Splits history available

stock-summary
BONUS

No Bonus history available

stock-summary
RIGHTS

No Rights history available

stock-summaryKey Factors

Quality key factors stock-summary

Factor
Value
Sales Growth (5y)
5.71%
EBIT Growth (5y)
24.43%
EBIT to Interest (avg)
2.24
Debt to EBITDA (avg)
3.38
Net Debt to Equity (avg)
0.01
Sales to Capital Employed (avg)
1.88
Tax Ratio
13.07%
Dividend Payout Ratio
359.29%
Pledged Shares
0
Institutional Holding
22.98%
ROCE (avg)
11.27%
ROE (avg)
7.75%

Valuation key factors

Factor
Value
P/E Ratio
47
Industry P/E
18
Price to Book Value
14.47
EV to EBIT
50.08
EV to EBITDA
39.91
EV to Capital Employed
14.34
EV to Sales
4.69
PEG Ratio
0.44
Dividend Yield
0.15%
ROCE (Latest)
30.29%
ROE (Latest)
23.66%

Technicals key factors

Indicator
Weekly
Monthly
MACD
Mildly Bearish
Bullish
RSI
No Signal
Bearish
Bollinger Bands
Bearish
Mildly Bullish
Moving Averages
Mildly Bullish (Daily)
KST
Mildly Bearish
Bullish
Dow Theory
No Trend
Bullish
OBV
No Trend
Bullish
stock-summary Technical Indicator Scale: Bearish, Mildly Bearish, Sideways, Mildly Bullish, Bullish  Turned 
stock-summaryShareholding
Shareholding Snapshot : Jun 2026stock-summary
Shareholding Compare (%holding) stock-summary
Majority shareholders

Promoters

Pledged Promoter Holdings

None

Mutual Funds

Held by 3 Schemes (9.6%)

FIIs

Held by 38 FIIs (3.31%)

Promoter with highest holding

Apparao Venkata Mallavarapu (35.45%)

Highest Public shareholder

Hdfc Trustee Company Limited - Hdfc Infrastructure (8.97%)

Individual Investors Holdings

21.41%

stock-summaryFinancial
[
  {
    "link": "quarterly",
    "btn_text": "All Quarterly Results",
    "header": "Quarterly Results Snapshot (Consolidated) - Jun'26 - YoY",
    "rhs": [
      {
        "prefix": "Net Sales ",
        "suffix": "YoY Growth in quarter ended Jun 2026 is 14.35% vs -27.28% in Jun 2025",
        "dir": 1
      },
      {
        "prefix": "Consolidated Net Profit ",
        "suffix": "YoY Growth in quarter ended Jun 2026 is 2,239.25% vs 217.45% in Jun 2025",
        "dir": 1
      }
    ],
    "table": {
      "header": [
        "Jun'26",
        "Jun'25",
        "Change(%)"
      ],
      "body": [
        {
          "field": "Net Sales",
          "val1": "204.15",
          "val2": "178.53",
          "chgp": "14.35%",
          "chgp_class": "positive"
        },
        {
          "field": "Operating Profit (PBDIT) excl Other Income",
          "val1": "23.56",
          "val2": "28.14",
          "chgp": "-16.28%",
          "chgp_class": "negative"
        },
        {
          "field": "Interest",
          "val1": "4.42",
          "val2": "3.27",
          "chgp": "35.17%",
          "chgp_class": "negative"
        },
        {
          "field": "Exceptional Items",
          "val1": "94.27",
          "val2": "-13.28",
          "chgp": "809.86%",
          "chgp_class": "positive"
        },
        {
          "field": "Consolidate Net Profit",
          "val1": "105.50",
          "val2": "4.51",
          "chgp": "2,239.25%",
          "chgp_class": "positive"
        },
        {
          "field": "Operating Profit Margin (Excl OI)",
          "val1": "11.58%",
          "val2": "15.82%",
          "chgp": "-4.24%",
          "chgp_class": "negative"
        }
      ]
    }
  },
  {
    "link": "half-yearly",
    "btn_text": "All Half Yearly Results",
    "header": "Half Yearly Results Snapshot (Consolidated) - Sep'25",
    "rhs": [
      {
        "prefix": "Net Sales ",
        "suffix": " Growth in half year ended Sep 2025 is 11.61% vs 1.94% in Sep 2024",
        "dir": 1
      },
      {
        "prefix": "Consolidated Net Profit ",
        "suffix": " Growth in half year ended Sep 2025 is 309.38% vs -33.76% in Sep 2024",
        "dir": 1
      }
    ],
    "table": {
      "header": [
        "Sep'25",
        "Sep'24",
        "Change(%)"
      ],
      "body": [
        {
          "field": "Net Sales",
          "val1": "564.02",
          "val2": "505.34",
          "chgp": "11.61%",
          "chgp_class": "positive"
        },
        {
          "field": "Operating Profit (PBDIT) excl Other Income",
          "val1": "40.62",
          "val2": "35.78",
          "chgp": "13.53%",
          "chgp_class": "positive"
        },
        {
          "field": "Interest",
          "val1": "15.41",
          "val2": "15.26",
          "chgp": "0.98%",
          "chgp_class": "negative"
        },
        {
          "field": "Exceptional Items",
          "val1": "1.77",
          "val2": "0.00",
          "chgp": "",
          "chgp_class": "neutral"
        },
        {
          "field": "Consolidate Net Profit",
          "val1": "8.71",
          "val2": "-4.16",
          "chgp": "309.38%",
          "chgp_class": "positive"
        },
        {
          "field": "Operating Profit Margin (Excl OI)",
          "val1": "7.38%",
          "val2": "7.31%",
          "chgp": "0.07%",
          "chgp_class": "positive"
        }
      ]
    }
  },
  {
    "link": "nine-monthly",
    "btn_text": "All Nine Monthly Results",
    "header": "Nine Monthly Results Snapshot (Consolidated) - Dec'25",
    "rhs": [
      {
        "prefix": "Net Sales ",
        "suffix": "YoY Growth in nine months ended Dec 2025 is 2.91% vs -1.96% in Dec 2024",
        "dir": 1
      },
      {
        "prefix": "Consolidated Net Profit ",
        "suffix": "YoY Growth in nine months ended Dec 2025 is -127.37% vs -666.67% in Dec 2024",
        "dir": 1
      }
    ],
    "table": {
      "header": [
        "Dec'25",
        "Dec'24",
        "Change(%)"
      ],
      "body": [
        {
          "field": "Net Sales",
          "val1": "801.06",
          "val2": "778.38",
          "chgp": "2.91%",
          "chgp_class": "positive"
        },
        {
          "field": "Operating Profit (PBDIT) excl Other Income",
          "val1": "72.71",
          "val2": "62.37",
          "chgp": "16.58%",
          "chgp_class": "positive"
        },
        {
          "field": "Interest",
          "val1": "19.60",
          "val2": "23.18",
          "chgp": "-15.44%",
          "chgp_class": "positive"
        },
        {
          "field": "Exceptional Items",
          "val1": "-93.16",
          "val2": "-27.95",
          "chgp": "-233.31%",
          "chgp_class": "negative"
        },
        {
          "field": "Consolidate Net Profit",
          "val1": "-53.34",
          "val2": "-23.46",
          "chgp": "-127.37%",
          "chgp_class": "negative"
        },
        {
          "field": "Operating Profit Margin (Excl OI)",
          "val1": "9.08%",
          "val2": "8.01%",
          "chgp": "1.07%",
          "chgp_class": "positive"
        }
      ]
    }
  },
  {
    "link": "annual",
    "btn_text": "All Annual Results",
    "header": "Annual Results Snapshot (Consolidated) - Mar'26",
    "rhs": [
      {
        "prefix": "Net Sales ",
        "suffix": "YoY Growth in year ended Mar 2026 is 28.70% vs -32.14% in Mar 2025",
        "dir": 1
      },
      {
        "prefix": "Consolidated Net Profit ",
        "suffix": "YoY Growth in year ended Mar 2026 is -2,584.46% vs 30.07% in Mar 2025",
        "dir": -1
      }
    ],
    "table": {
      "header": [
        "Mar'26",
        "Mar'25",
        "Change(%)"
      ],
      "body": [
        {
          "field": "Net Sales",
          "val1": "952.75",
          "val2": "740.26",
          "chgp": "28.70%",
          "chgp_class": "positive"
        },
        {
          "field": "Operating Profit (PBDIT) excl Other Income",
          "val1": "135.45",
          "val2": "98.91",
          "chgp": "36.94%",
          "chgp_class": "positive"
        },
        {
          "field": "Interest",
          "val1": "16.91",
          "val2": "19.50",
          "chgp": "-13.28%",
          "chgp_class": "positive"
        },
        {
          "field": "Exceptional Items",
          "val1": "-152.52",
          "val2": "-52.35",
          "chgp": "-191.35%",
          "chgp_class": "negative"
        },
        {
          "field": "Consolidate Net Profit",
          "val1": "-51.81",
          "val2": "-1.93",
          "chgp": "-2,584.46%",
          "chgp_class": "negative"
        },
        {
          "field": "Operating Profit Margin (Excl OI)",
          "val1": "14.25%",
          "val2": "13.40%",
          "chgp": "0.85%",
          "chgp_class": "positive"
        }
      ]
    }
  }
]

Quarterly Results Snapshot (Consolidated) - Jun'26 - YoYstock-summary

Jun'26
Jun'25
Change(%)
Net Sales
204.15
178.53
14.35%
Operating Profit (PBDIT) excl Other Income
23.56
28.14
-16.28%
Interest
4.42
3.27
35.17%
Exceptional Items
94.27
-13.28
809.86%
Consolidate Net Profit
105.50
4.51
2,239.25%
Operating Profit Margin (Excl OI)
11.58%
15.82%
-4.24%
Values in Rs Cr.
Direction Arrows
Net Sales

YoY Growth in quarter ended Jun 2026 is 14.35% vs -27.28% in Jun 2025

Direction Arrows
Consolidated Net Profit

YoY Growth in quarter ended Jun 2026 is 2,239.25% vs 217.45% in Jun 2025

Half Yearly Results Snapshot (Consolidated) - Sep'25stock-summary

Sep'25
Sep'24
Change(%)
Net Sales
564.02
505.34
11.61%
Operating Profit (PBDIT) excl Other Income
40.62
35.78
13.53%
Interest
15.41
15.26
0.98%
Exceptional Items
1.77
0.00
Consolidate Net Profit
8.71
-4.16
309.38%
Operating Profit Margin (Excl OI)
7.38%
7.31%
0.07%
Values in Rs Cr.
Direction Arrows
Net Sales

Growth in half year ended Sep 2025 is 11.61% vs 1.94% in Sep 2024

Direction Arrows
Consolidated Net Profit

Growth in half year ended Sep 2025 is 309.38% vs -33.76% in Sep 2024

Nine Monthly Results Snapshot (Consolidated) - Dec'25stock-summary

Dec'25
Dec'24
Change(%)
Net Sales
801.06
778.38
2.91%
Operating Profit (PBDIT) excl Other Income
72.71
62.37
16.58%
Interest
19.60
23.18
-15.44%
Exceptional Items
-93.16
-27.95
-233.31%
Consolidate Net Profit
-53.34
-23.46
-127.37%
Operating Profit Margin (Excl OI)
9.08%
8.01%
1.07%
Values in Rs Cr.
Direction Arrows
Net Sales

YoY Growth in nine months ended Dec 2025 is 2.91% vs -1.96% in Dec 2024

Direction Arrows
Consolidated Net Profit

YoY Growth in nine months ended Dec 2025 is -127.37% vs -666.67% in Dec 2024

Annual Results Snapshot (Consolidated) - Mar'26stock-summary

Mar'26
Mar'25
Change(%)
Net Sales
952.75
740.26
28.70%
Operating Profit (PBDIT) excl Other Income
135.45
98.91
36.94%
Interest
16.91
19.50
-13.28%
Exceptional Items
-152.52
-52.35
-191.35%
Consolidate Net Profit
-51.81
-1.93
-2,584.46%
Operating Profit Margin (Excl OI)
14.25%
13.40%
0.85%
Values in Rs Cr.
Direction Arrows
Net Sales

YoY Growth in year ended Mar 2026 is 28.70% vs -32.14% in Mar 2025

Direction Arrows
Consolidated Net Profit

YoY Growth in year ended Mar 2026 is -2,584.46% vs 30.07% in Mar 2025

stock-summaryCompany CV
About Centum Electronics Ltd stock-summary
stock-summary
Centum Electronics Ltd
Small Cap
Industrial Manufacturing
Centum Electronics Limited was erstwhile incorporated in the name of 'Solectron Centum Electronics Limited' on January 8, 1993 in Bangalore, India. The Company changed the name from ''Solectron Centum Electronics Limited" to 'Centum Electronics Limited' on December 3, 2007. The Company designs and manufactures advanced electronics systems, subsystems and modules. It caters to Defense, Space, Communications and Automotive Electronics markets.
Company Coordinates stock-summary
Company Details
No 44 KHB Industrial Area, Yelahanka New Township Bangalore Karnataka : 560106
stock-summary
Tel: 91-80-41436000
stock-summary
investors@centumelectronics.com
Registrar Details
Karvy Computershare Pvt Ltd., Karvy Selenium, Tower-B Plot No 31 & 32, Survey No 116/22, 115/24, 115/25, Financial District, Nanakramguda, Serilingampally, Mandal Ranga Reddy Dist, Hyderabad