
 Price Point
Compare V-Guard Industri with Similar Stocks
ScoreDashboard
Company has a Debt to Equity ratio (avg) of 0.10 times
Poor long term growth as Operating profit has grown by an annual rate 9.64% of over the last 5 years
Positive results in Jun 26
With ROE of 13.7, it has a Fair valuation with a 5.9 Price to Book Value
High Institutional Holdings at 35.25%
With its market cap of Rs 13,959 cr, it is the second biggest company in the sector (behind Metro Brands)and constitutes 14.28% of the entire sector
Mojo ParametersStock DNA

Electronics & Appliances

INR 13,940 Cr (Small Cap)

37.00
41

0.47%

-0.03

13.68%

5.88
Total ReturnsTotal Returns (Price + Dividend) 
Latest dividend: 1.5011931275851098 per share ex-dividend date: Jul-31-2026
Risk Adjusted Returns v/s
Returns Beta
 News & Corporate Actions
News
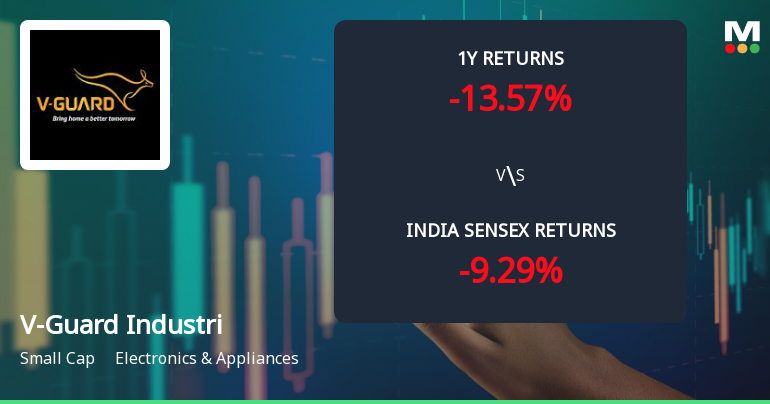
V-Guard Industries Ltd Technical Momentum Shifts to Mildly Bullish Amid Mixed Signals
V-Guard Industries Ltd, a small-cap player in the Electronics & Appliances sector, has exhibited a notable shift in technical momentum, moving from a mildly bearish to a mildly bullish trend. This transition is underscored by mixed signals from key technical indicators such as MACD, RSI, Bollinger Bands, and moving averages, suggesting cautious optimism among investors as the stock navigates near-term resistance levels.
Read full news article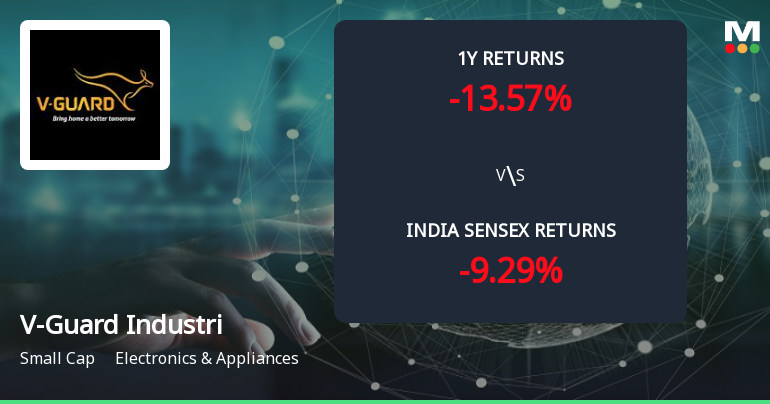
Golden Cross Forms in V-Guard Industries Ltd — On a Day the Stock Fell 1.42%. What the Mixed Signals Mean
The 50-day moving average has crossed above the 200-day moving average for V-Guard Industries Ltd, signalling a golden cross on 22 Sep 2026. Yet, the stock declined 1.42% on the day this technical event occurred, while monthly momentum indicators remain bearish. This juxtaposition of signals calls for a detailed examination of the cross’s reliability in the current context.
Read full news article
V-Guard Industries Ltd is Rated Hold
V-Guard Industries Ltd is rated 'Hold' by MarketsMOJO, with this rating last updated on 13 May 2026. However, the analysis and financial metrics discussed here reflect the company’s current position as of 15 September 2026, providing investors with an up-to-date view of its fundamentals, returns, and overall outlook.
Read full news article Announcements
V-Guard Industries Limited - Other General Purpose
21-Nov-2019 | Source : NSEV-Guard Industries Limited has submitted to the Exchange a copy of Disclosure of Related Party Transactions U/R 23(9) For The Half-Year Ended September 30, 2019.
V-Guard Industries Limited - Reply to Clarification- Financial results
14-Nov-2019 | Source : NSEV-Guard Industries Limitedd Industries Limited for the quarter ended 30-Sep-2019 with respect to Regulation 33 of the SEBI (Listing Obligations and Disclosure Requirements) Regulations, 2015.
V-Guard Industries Limited - Clarification - Financial Results
08-Nov-2019 | Source : NSEV-Guard Industries Limitedries Limited for the quarter ended 30-Sep-2019 with respect to Regulation 33 of the SEBI (Listing Obligations and Disclosure Requirements) Regulations, 2015.
Corporate Actions

No Upcoming Board Meetings

V-Guard Industries Ltd has declared 150% dividend, ex-date: 31 Jul 26

V-Guard Industries Ltd has announced 1:10 stock split, ex-date: 30 Aug 16

V-Guard Industries Ltd has announced 2:5 bonus issue, ex-date: 15 Mar 17

No Rights history available
Key FactorsQuality key factors
Valuation key factors
Technicals key factors
 Technical Indicator Scale: Bearish, Mildly Bearish, Sideways, Mildly Bullish, Bullish Turned Shareholding
Shareholding Snapshot : Jun 2026
Shareholding Compare (%holding)
Promoters
None
Held by 11 Schemes (23.11%)
Held by 117 FIIs (12.01%)
Mithun Kochouseph Chittilappilly (19.78%)
Icici Prudential Multi-asset Fund (7.64%)
7.15%
FinancialQuarterly Results Snapshot (Consolidated) - Jun'26 - QoQ
 Compare with Peers
QoQ Growth in quarter ended Jun 2026 is 3.16% vs 25.06% in Mar 2026
QoQ Growth in quarter ended Jun 2026 is 16.16% vs 96.51% in Mar 2026

Half Yearly Results Snapshot (Consolidated) - Sep'25
Growth in half year ended Sep 2025 is 1.30% vs 17.99% in Sep 2024
Growth in half year ended Sep 2025 is -14.30% vs 31.82% in Sep 2024
Nine Monthly Results Snapshot (Consolidated) - Dec'25
YoY Growth in nine months ended Dec 2025 is 4.23% vs 14.96% in Dec 2024
YoY Growth in nine months ended Dec 2025 is -11.85% vs 22.69% in Dec 2024
Annual Results Snapshot (Consolidated) - Mar'26
YoY Growth in year ended Mar 2026 is 6.96% vs 14.85% in Mar 2025
YoY Growth in year ended Mar 2026 is -1.72% vs 21.80% in Mar 2025
 Company CV
About V-Guard Industries Ltd

Company Coordinates










