
Compare PG Electroplast with Similar Stocks
Stock DNA
Electronics & Appliances
INR 17,402 Cr (Small Cap)
87.00
60
0.04%
0.07
6.45%
5.66
Total Returns (Price + Dividend) 
Latest dividend: 0.24864864864864863 per share ex-dividend date: Sep-19-2025
Risk Adjusted Returns v/s
Returns Beta

News

PG Electroplast Ltd is Rated Sell
PG Electroplast Ltd is rated 'Sell' by MarketsMOJO, with this rating last updated on 05 May 2026. However, the analysis and financial metrics discussed here reflect the stock's current position as of 11 July 2026, providing investors with the latest insights into its performance and outlook.
Read full news article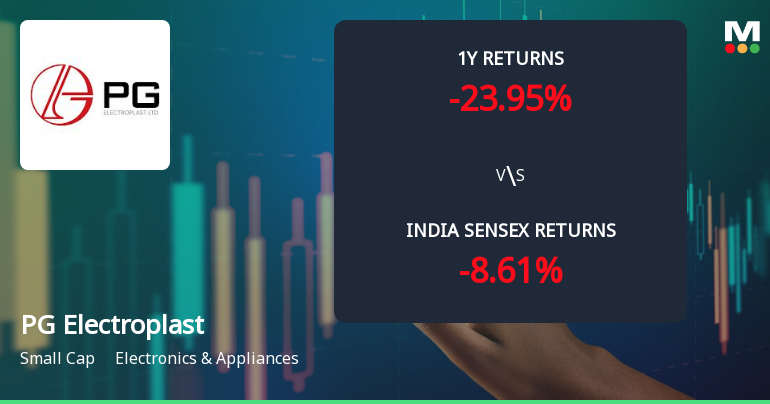
PG Electroplast Ltd Technical Momentum Shifts Amid Mixed Indicator Signals
PG Electroplast Ltd, a small-cap player in the Electronics & Appliances sector, has experienced a notable shift in its technical momentum, reflecting a complex interplay of bullish and bearish signals across multiple timeframes. Despite a recent downgrade to a Sell rating, the stock’s price action and technical indicators suggest a sideways trend with pockets of optimism and caution for investors navigating this evolving landscape.
Read full news article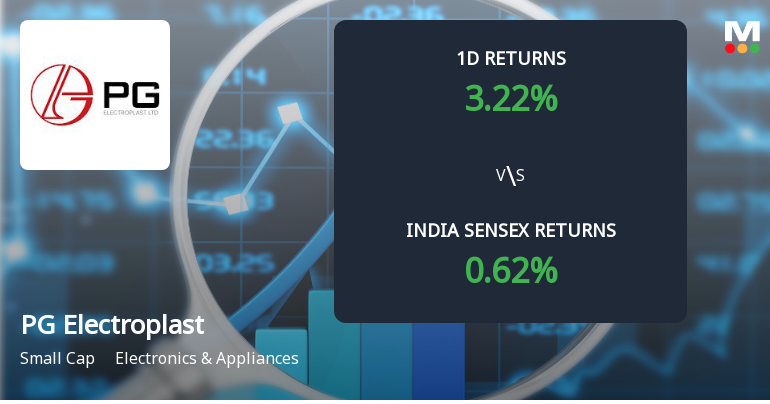
PG Electroplast Ltd Sees Significant Open Interest Surge Amid Market Rebound
PG Electroplast Ltd (PGEL), a small-cap player in the Electronics & Appliances sector, witnessed a notable surge in open interest (OI) in its derivatives segment on 1 Jul 2026. The stock outperformed its sector and broader indices, signalling renewed investor interest and potential shifts in market positioning after a period of consolidation and subdued participation.
Read full news article Announcements
PG Electroplast Limited - Registrar & Share Transfer Agent Update
09-Dec-2019 | Source : NSEPG Electroplast Limited has informed the Exchange regarding the Registrar & Share Transfer Agent Update
PG Electroplast Limited - Investor Presentation
15-Nov-2019 | Source : NSEPG Electroplast Limited has informed the Exchange regarding Investor Presentation on Unaudited Financial Results of the Company for quarter and half year ended on September 30, 2019
PG Electroplast Limited - Updates
23-Oct-2019 | Source : NSEPG Electroplast Limited has informed the Exchange regarding 'Resignation of Secretarial Auditor of the Company '.
Corporate Actions

No Upcoming Board Meetings

PG Electroplast Ltd has declared 25% dividend, ex-date: 19 Sep 25

PG Electroplast Ltd has announced 1:10 stock split, ex-date: 10 Jul 24

No Bonus history available

No Rights history available
Quality key factors
Valuation key factors
Technicals key factors
 Technical Indicator Scale: Bearish, Mildly Bearish, Sideways, Mildly Bullish, Bullish Turned
 Shareholding Snapshot : Jun 2026
Shareholding Compare (%holding)
Promoters
None
Held by 28 Schemes (18.65%)
Held by 95 FIIs (9.95%)
Vishal Gupta (16.04%)
Icici Prudential Manufacturing Fund (5.4%)
17.91%
Quarterly Results Snapshot (Consolidated) - Mar'26 - YoY

YoY Growth in quarter ended Mar 2026 is -10.11% vs 77.40% in Mar 2025
YoY Growth in quarter ended Mar 2026 is -55.34% vs 108.81% in Mar 2025
Half Yearly Results Snapshot (Consolidated) - Sep'25
Growth in half year ended Sep 2025 is 8.40% vs 75.04% in Sep 2024
Growth in half year ended Sep 2025 is -32.30% vs 123.13% in Sep 2024
Nine Monthly Results Snapshot (Consolidated) - Dec'25
YoY Growth in nine months ended Dec 2025 is 20.67% vs 77.23% in Dec 2024
YoY Growth in nine months ended Dec 2025 is -7.62% vs 118.15% in Dec 2024
Annual Results Snapshot (Consolidated) - Mar'26
YoY Growth in year ended Mar 2026 is 8.59% vs 77.30% in Mar 2025
YoY Growth in year ended Mar 2026 is -31.70% vs 113.34% in Mar 2025
About PG Electroplast Ltd

Company Coordinates


