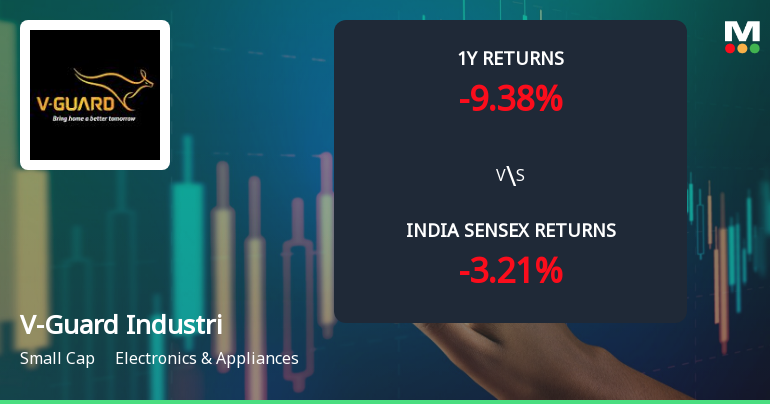
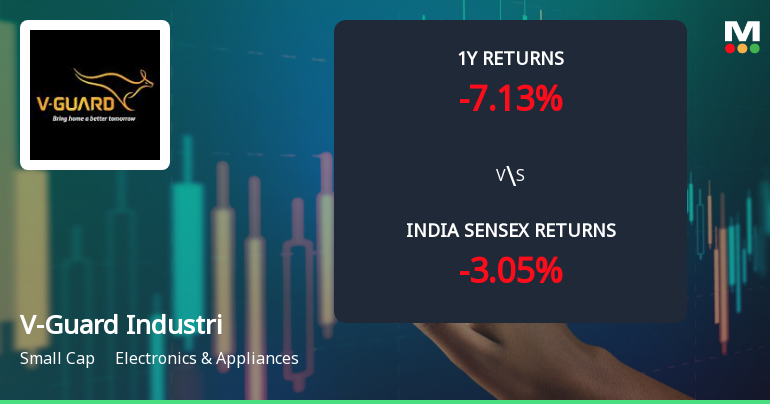
V-Guard Industri

  • Market Cap: Small Cap
  • Industry: Electronics & Appliances
  • ISIN: INE951I01027
  • NSEID: VGUARD
  • BSEID: 532953
INR
342.15
-0.9 (-0.26%)
BSENSE

Sep 02, 02:28 PM

BSE+NSE Vol: 3.85 lacs

  • Price Points
  • Score
  • Mojo Parameters
  • Total Return
  • News and Corporate Actions
  • Key factors
  • Shareholding
  • Financials
  • CompanyCV
stock-summaryPrice Point
High/Low

1Day

52 Week

Valuation
Technical
Day's Volume

CASH

3.85 lacs (-18.88%) Volume

Shareholding (Jun 2026)

FII

12.01%

Held by 117 FIIs

DII

23.24%

Held by 40 DIIs

Promoter

53.22%

Why is V-Guard Industries Ltd falling/rising?

02-Sep-2026

As of 01-Sep, V-Guard Industries Ltd's stock price is at 344.00, down 0.55%, but has shown positive returns of +3.46% over the past week and +9.36% over the month, indicating strong momentum and investor interest despite the recent decline. The company's solid financial performance and low debt-to-equity ratio suggest it is well-positioned for potential recovery.

As of 01-Sep, V-Guard Industries Ltd's stock price is currently at 344.00, reflecting a decrease of 1.9 (-0.55%). Despite this recent decline, the stock has shown a positive performance over the past week and month, with returns of +3.46% and +9.36%, respectively. This indicates that the stock has been on an upward trend prior to this slight drop.<BR><BR>The stock has been gaining for the last four days, with a total increase of 4.86% during this period, suggesting strong momentum. Additionally, V-Guard Industries is trading above its moving averages across various time frames, including the 5-day, 20-day, 50-day, 100-day, and 200-day averages, which is typically a bullish signal.<BR><BR>Investor participation has also increased significantly, with a delivery volume of 10.73 lacs on August 31, marking a rise of 353.21% compared to the 5-day average. This heightened interest from investors contributes positively to the stock's performance.<BR><BR>Financially, the company has reported strong results, including a 57.6% growth in profit before tax compared to the previous four-quarter average and a higher profit after tax for the nine months. The company maintains a low debt-to-equity ratio of 0.10, indicating financial stability. Furthermore, with a return on equity of 13.7 and a fair valuation relative to its peers, V-Guard Industries appears to be positioned well in the market.<BR><BR>Despite the current decline in stock price, the overall trends and financial indicators suggest that V-Guard Industries Ltd has been performing well, which may lead to a recovery in its stock price in the near future.

View full answer

Who are in the management team of V-Guard Industri?

01-Sep-2026

The management team of V-Guard Industries includes Kochouseph Chittilappilly (Chairman Emeritus), Mithun K Chittilappilly (Managing Director), and several independent directors, along with executive directors like Ramachandran Venkataraman and Antony Sebastian K. This team is responsible for the company's strategic direction and operations.

The management team of V-Guard Industries includes the following key members:<BR><BR>1. **Kochouseph Chittilappilly** - Chairman Emeritus<BR>2. **Mithun K Chittilappilly** - Managing Director<BR>3. **C J George** - Independent Director<BR>4. **Ramachandran Venkataraman** - Executive Director & COO<BR>5. **Cherian N Punnoose** - Chairman (Non-Executive)<BR>6. **Ullas K Kamath** - Independent Director<BR>7. **Radha Unni** - Independent Director<BR>8. **Biju Varkkey** - Independent Director<BR>9. **George Muthoot Jacob** - Independent Director<BR>10. **Vikas Kumar Tak** - Company Secretary & Compliance Officer<BR>11. **Ishwar Subramanian** - Independent Director<BR>12. **Antony Sebastian K.** - Executive Director<BR><BR>This team plays a crucial role in guiding the company's strategic direction and operations.

View full answer

What does V-Guard Industri do?

01-Sep-2026

V-Guard Industries Ltd is a multi-product company in the Electronics & Appliances industry, specializing in manufacturing and selling a variety of electrical and consumer durable products. As of June 2026, it reported net sales of ₹1,811 Cr and a net profit of ₹130 Cr, with a market cap of ₹14,490 Cr.

Overview:<BR>V-Guard Industries Ltd is a multi-product company engaged in manufacturing, trading, and selling a wide range of Electronics, Electrical, and Consumer Durables, operating within the Electronics & Appliances industry and classified as a Small Cap company.<BR><BR>History:<BR>V-Guard Industries Ltd was incorporated in an unspecified year and has maintained its status as a multi-product company. The latest quarterly results reported are for June 2026, showing net sales and profit figures.<BR><BR>Financial Snapshot:<BR>- Net Sales: 1,811 Cr (Quarterly Results - Jun 2026)<BR>- Net Profit: 130 Cr (Quarterly Results - Jun 2026)<BR>- Market Cap: INR 14,490 Cr (Small Cap)<BR><BR>Key Metrics:<BR>- P/E: 40.00<BR>- Industry P/E: 43<BR>- Dividend Yield: 0.45%<BR>- Debt Equity: -0.03<BR>- Return on Equity: 13.68%<BR>- Price to Book: 6.18<BR><BR>Contact Details:<BR>Address: No 42/962 Vennala High, School Road Vennala Kochi Kerala : 682028<BR>Tel: 91-0484-3005000<BR>Email: mail@vguard.in<BR>Website: http://www.vguard.in

View full answer

Who are the peers of the V-Guard Industri?

01-Sep-2026

V-Guard Industri's peers include Voltas, Blue Star, Amber Enterprises, PG Electroplast, Crompton Greaves Consumer, Whirlpool India, Eureka Forbes, TTK Prestige, and Cello World. In terms of management risk, V-Guard is rated as Good, with its 1-year return at -4.74%, better than Whirlpool India's -38.22% but worse than Amber Enterprises' 5.03%.

Peers: The peers of V-Guard Industri are Voltas, Blue Star, Amber Enterp., PG Electroplast, Crompton Gr. Con, Whirlpool India, Eureka Forbes, TTK Prestige, and Cello World.<BR><BR>Quality Snapshot: Excellent management risk is observed at Blue Star, Crompton Gr. Con, and TTK Prestige, while Good management risk is found at V-Guard Industri and the rest. Average management risk is present at Voltas, Amber Enterp., PG Electroplast, Whirlpool India, and Cello World, while Below Average management risk is noted at Eureka Forbes. Growth is Excellent for Blue Star, Amber Enterp., PG Electroplast, and Eureka Forbes, while Below Average growth is seen at V-Guard Industri, Voltas, Crompton Gr. Con, Whirlpool India, TTK Prestige, and Cello World. Excellent capital structure is noted at Voltas, Blue Star, Crompton Gr. Con, V-Guard Industri, Whirlpool India, Eureka Forbes, TTK Prestige, and Cello World, while Average capital structure is found at Amber Enterp. and PG Electroplast.<BR><BR>Return Snapshot: The peer with the highest 1-year return is Amber Enterp. at 5.03%, while Whirlpool India has the lowest at -38.22%. V-Guard Industri's 1-year return of -4.74% is better than Whirlpool India's but worse than Amber Enterp.'s. Additionally, peers with negative six-month returns include Voltas, Blue Star, Crompton Gr. Con, Whirlpool India, and Cello World.

View full answer

How big is V-Guard Industri?

01-Sep-2026

As of 31st August, V-Guard Industries Ltd has a market capitalization of 14,490.00 Cr, with recent net sales of 6310.35 Cr and a net profit of 364.73 Cr. The company has shareholder's funds of 2,373.05 Cr and total assets of 3,698.03 Cr as of March 2026.

As of 31st August, V-Guard Industries Ltd has a market capitalization of 14,490.00 Cr, categorizing it as a Small Cap company.<BR><BR>In the latest four quarters, V-Guard Industries reported Net Sales of 6310.35 Cr and a Net Profit of 364.73 Cr.<BR><BR>For the latest annual period ending in March 2026, the company has Shareholder's Funds amounting to 2,373.05 Cr and Total Assets of 3,698.03 Cr.

View full answer

Are V-Guard Industries Ltd latest results good or bad?

30-Jul-2026

V-Guard Industries Ltd's Q1 FY27 results are strong, with a 76.37% increase in net profit and a 23.50% rise in revenue, alongside improved operating margins. However, the stock has declined 20.63% over the past year, indicating a bearish outlook despite solid operational performance.

V-Guard Industries Ltd's latest results for Q1 FY27 are quite strong, showcasing significant improvements in both net profit and revenue. The company reported a net profit of ₹130.25 crores, which is a remarkable 76.37% increase year-on-year. Revenue also saw a robust growth of 23.50% compared to the same quarter last year, reaching ₹1,810.65 crores.<BR><BR>Additionally, the operating margin expanded to 10.55%, marking the highest quarterly margin in recent history, up from 8.43% in the previous year. This reflects improved operational efficiency and a favorable product mix. The company has demonstrated solid demand across its diverse product portfolio, which includes voltage stabilizers, water heaters, and kitchen appliances.<BR><BR>However, despite these positive results, the stock has faced challenges, declining 20.63% over the past year, which is significantly worse than the broader market's performance. The technical indicators for the stock are currently bearish, as it trades below all major moving averages.<BR><BR>In summary, while V-Guard's operational performance in Q1 FY27 is commendable, the stock's recent underperformance and bearish technical outlook may temper the overall sentiment. Investors should weigh these factors carefully.

View full answer

Should I buy, sell or hold V-Guard Industries Ltd?

30-Jul-2026

When is the next results date for V-Guard Industries Ltd?

17-Jul-2026

The next results date for V-Guard Industries Ltd is 29 July 2026.

The next results date for V-Guard Industries Ltd is scheduled for 29 July 2026.

View full answer

How has been the historical performance of V-Guard Industri?

12-Nov-2025

V-Guard Industries has shown consistent growth in net sales and profitability, with net sales increasing from ₹2,721.24 Cr in Mar'21 to ₹5,577.82 Cr in Mar'25, and profit after tax rising from ₹201.89 Cr to ₹313.72 Cr during the same period. The company has also improved operational efficiency, reflected in higher operating profit and earnings per share.

Answer:<BR>The historical performance of V-Guard Industries shows a consistent growth trajectory in net sales and profitability over the years.<BR><BR>Breakdown:<BR>V-Guard Industries has demonstrated significant growth in net sales, increasing from 2,721.24 Cr in Mar'21 to 5,577.82 Cr in Mar'25. This upward trend is reflected in total operating income, which rose from 2,721.24 Cr in Mar'21 to 5,577.82 Cr in Mar'25. The company's total expenditure also increased, from 2,409.14 Cr in Mar'21 to 5,064.59 Cr in Mar'25, but the operating profit (PBDIT) improved from 312.10 Cr in Mar'21 to 534.12 Cr in Mar'25, indicating enhanced operational efficiency. Profit before tax followed a similar pattern, growing from 288.10 Cr in Mar'21 to 413.95 Cr in Mar'25, while profit after tax increased from 201.89 Cr in Mar'21 to 313.72 Cr in Mar'25. The earnings per share (EPS) also saw an increase from 4.67 in Mar'21 to 7.2 in Mar'25. On the balance sheet, total assets rose from 1,871.16 Cr in Mar'21 to 3,329.13 Cr in Mar'25, with total liabilities increasing from 1,452.42 Cr to 3,329.13 Cr during the same period. Cash flow from operating activities improved significantly, reaching 476.00 Cr in Mar'25 compared to 222.00 Cr in Mar'21, while the net cash inflow remained positive at 2.00 Cr in Mar'25, contrasting with previous years of outflow. Overall, V-Guard Industries has shown a robust performance with increasing sales, profits, and asset growth over the years.

View full answer

How has been the historical performance of V-Guard Industri?

12-Nov-2025

V-Guard Industries has shown consistent growth, with net sales increasing from ₹2,721.24 Cr in Mar'21 to ₹5,577.82 Cr in Mar'25, and profit after tax rising from ₹201.89 Cr to ₹313.72 Cr in the same period, indicating strong operational performance and asset growth.

Answer:<BR>The historical performance of V-Guard Industries shows a consistent growth trajectory in net sales and profits over the years.<BR><BR>Breakdown:<BR>V-Guard Industries has demonstrated significant growth in net sales, increasing from 2,721.24 Cr in Mar'21 to 5,577.82 Cr in Mar'25. This upward trend is reflected in total operating income, which rose from 2,721.24 Cr in Mar'21 to 5,577.82 Cr in Mar'25. The company's total expenditure also increased, but at a slower pace, from 2,409.14 Cr in Mar'21 to 5,064.59 Cr in Mar'25, leading to an operating profit of 534.12 Cr in Mar'25, up from 332.83 Cr in Mar'21. Profit before tax followed a similar upward trend, reaching 413.95 Cr in Mar'25 compared to 288.10 Cr in Mar'21. The profit after tax also saw a rise, reaching 313.72 Cr in Mar'25 from 201.89 Cr in Mar'21. The company's total assets increased from 1,871.16 Cr in Mar'21 to 3,329.13 Cr in Mar'25, while total liabilities grew from 1,452.42 Cr to 3,329.13 Cr in the same period. Cash flow from operating activities improved significantly, reaching 476.00 Cr in Mar'25, compared to 222.00 Cr in Mar'21, indicating a strong operational performance. Overall, V-Guard Industries has shown robust growth in sales, profits, and asset base over the years.

View full answer

Is V-Guard Industri technically bullish or bearish?

10-Nov-2025

As of November 7, 2025, V-Guard Industries shows a bearish trend with moderate strength, driven by bearish signals from key indicators like the weekly MACD, Bollinger Bands, and daily moving averages, despite mixed signals from Dow Theory.

As of 7 November 2025, the technical trend has changed from mildly bearish to bearish. The current stance is bearish with a moderate strength. Key indicators driving this include the weekly MACD and Bollinger Bands both indicating bearish conditions, along with daily moving averages also showing bearish signals. The KST on a weekly basis is bearish, while the monthly KST remains mildly bearish. The Dow Theory presents a mixed view with a mildly bullish weekly signal but a mildly bearish monthly signal. Overall, the technical indicators suggest a negative outlook for V-Guard Industries in the near term.

View full answer

Is V-Guard Industri overvalued or undervalued?

03-Nov-2025

As of October 31, 2025, V-Guard Industries is considered undervalued with a PE ratio of 54.33, an EV to EBITDA of 31.71, and a Price to Book Value of 0.72, making it more favorably valued compared to peers like Metro Brands and Bata India, despite a YTD return of -14.45% against the Sensex, while maintaining a strong 5-year return of 113.13%.

As of 31 October 2025, V-Guard Industries has moved from a fair to an attractive valuation grade. The company is currently considered undervalued. Key ratios include a PE ratio of 54.33, an EV to EBITDA of 31.71, and a Price to Book Value of 0.72, which suggest that the stock is trading at a reasonable price relative to its earnings and book value.<BR><BR>In comparison to its peers, V-Guard's PE ratio is significantly lower than that of Metro Brands at 86.64 and Bata India at 73.19, indicating a more favorable valuation. Additionally, V-Guard's EV to EBITDA is competitive compared to Relaxo Footwear at 28.11 and Campus Activewear at 35.21. Despite recent underperformance against the Sensex, with a YTD return of -14.45% compared to the Sensex's 7.42%, the long-term performance remains strong, with a 5-year return of 113.13%.

View full answer

Who are the top shareholders of the V-Guard Industri?

17-Jul-2025

The top shareholders of V-Guard Industries include Mithun Kochouseph Chittilappilly with 19.82%, mutual funds at 20.27%, foreign institutional investors at 13.43%, and the SBI Small Cap Fund as the largest public shareholder with 7.52%. Individual investors collectively own 9.83% of the shares.

The top shareholders of V-Guard Industries include the promoters, who hold the majority of the shares. The promoter with the highest holding is Mithun Kochouseph Chittilappilly, who owns 19.82% of the company. Additionally, mutual funds hold 20.27% of the shares across 18 schemes, while foreign institutional investors (FIIs) account for 13.43% through 125 different entities. The highest public shareholder is the SBI Small Cap Fund, which holds 7.52%. Individual investors collectively own 9.83% of the shares.

View full answer

What is the bonus history of the V-Guard Industri?

06-Jun-2025

V-Guard Industries Ltd issued a 2:5 bonus on March 15, 2017, meaning shareholders received 2 additional shares for every 5 shares held, with a record date of March 16, 2017.

V-Guard Industries Ltd has a recorded bonus history that includes a 2:5 bonus issue, which was announced with an ex-date of March 15, 2017. The record date for this bonus was March 16, 2017. This means that for every 5 shares held, shareholders received 2 additional shares as a bonus. If you have any more questions about V-Guard Industries or its financial activities, feel free to ask!

View full answer

Has V-Guard Industri declared dividend?

06-Jun-2025

Yes, V-Guard Industries Ltd has declared a dividend of 140% (₹1.4 per share) with an ex-date of July 25, 2024. While recent returns have been mixed, the company has shown significant long-term growth, particularly a 102.56% price return over the last five years.

V-Guard Industries Ltd has declared a dividend.<BR><BR>Dividend Details:<BR>- Percentage announced: 140%<BR>- Amount per share: 1.4<BR>- Ex-date: 25 Jul 24<BR><BR>Dividend Yield: 0.38%.<BR><BR>Total Returns by Period:<BR>In the last 6 months, the price return was -13.81%, with no dividend return, resulting in a total return of -13.81%.<BR><BR>Over the past year, the price return was -5.58%, the dividend return was 0.35%, leading to a total return of -5.23%.<BR><BR>In the 2-year period, the price return was 48.25%, the dividend return was 1.05%, resulting in a total return of 49.3%.<BR><BR>For the 3-year period, the price return was 61.35%, with a dividend return of 1.89%, culminating in a total return of 63.24%.<BR><BR>In the 4-year period, the price return was 44.1%, the dividend return was 1.94%, leading to a total return of 46.04%.<BR><BR>Over the last 5 years, the price return was 102.56%, with a dividend return of 3.05%, resulting in a total return of 105.61%.<BR><BR>Overall, V-Guard Industries Ltd has declared a substantial dividend, and while recent returns have been mixed, the long-term performance shows significant growth, particularly in price returns over the last five years.

View full answer
iScoreScore
Click here to find our call on this stock
Strong Sell
Sell
Hold
Buy
Strong Buy

Dashboard

1

Company has a Debt to Equity ratio (avg) of 0.10 times

 
2

Poor long term growth as Operating profit has grown by an annual rate 9.64% of over the last 5 years

 
3

Positive results in Jun 26

4

With ROE of 13.7, it has a Fair valuation with a 6.4 Price to Book Value

5

High Institutional Holdings at 35.25%

6

With its market cap of Rs 15,126 cr, it is the second biggest company in the sector (behind Metro Brands)and constitutes 14.78% of the entire sector

stock-summaryMojo Parameters

Mojo Parameters

Loading Valuation Snapshot...

Stock DNA

stock-summary
Industry

Electronics & Appliances

stock-summary
Market cap

INR 14,949 Cr (Small Cap)

stock-summary
P/E

40.00

stock-summary
Industry P/E

43

stock-summary
Dividend Yield

0.43%

stock-summary
Debt Equity

-0.03

stock-summary
Return on Equity

13.68%

stock-summary
Price to Book

6.37

Revenue and Profits:
Net Sales:
1,811 Cr
(Quarterly Results - Jun 2026)
Net Profit:
130 Cr
stock-summaryTotal Returns
Total Returns (Price + Dividend) stock-summary
Dividend Yield (0.43%)
TimePeriod
Price Return
Dividend Return
Total Return
3 Months
12.64%
0.50%
13.14%
6 Months
9.8%
0.48%
10.28%
1 Year
-3.93%
0.40%
-3.53%
2 Years
-24.48%
0.65%
-23.83%
3 Years
8.98%
1.43%
10.41%
4 Years
40.25%
2.30%
42.55%
5 Years
41.59%
2.70%
44.29%

Latest dividend: 1.5011931275851098 per share ex-dividend date: Jul-31-2026

Risk Adjusted Returns v/s stock-summary
Returns Beta
Icon
Beta has not been calculated since enough price history is not available
stock-summaryNews & Corporate Actions

News

Announcements stock-summary

V-Guard Industries Limited - Other General Purpose

21-Nov-2019 | Source : NSE

V-Guard Industries Limited has submitted to the Exchange a copy of Disclosure of Related Party Transactions U/R 23(9) For The Half-Year Ended September 30, 2019.

V-Guard Industries Limited - Reply to Clarification- Financial results

14-Nov-2019 | Source : NSE

V-Guard Industries Limitedd Industries Limited for the quarter ended 30-Sep-2019 with respect to Regulation 33 of the SEBI (Listing Obligations and Disclosure Requirements) Regulations, 2015.

V-Guard Industries Limited - Clarification - Financial Results

08-Nov-2019 | Source : NSE

V-Guard Industries Limitedries Limited for the quarter ended 30-Sep-2019 with respect to Regulation 33 of the SEBI (Listing Obligations and Disclosure Requirements) Regulations, 2015.

Corporate Actions stock-summary

stock-summary
BOARD MEETING

No Upcoming Board Meetings

stock-summary
DIVIDEND

V-Guard Industries Ltd has declared 150% dividend, ex-date: 31 Jul 26

stock-summary
SPLITS

V-Guard Industries Ltd has announced 1:10 stock split, ex-date: 30 Aug 16

stock-summary
BONUS

V-Guard Industries Ltd has announced 2:5 bonus issue, ex-date: 15 Mar 17

stock-summary
RIGHTS

No Rights history available

stock-summaryKey Factors

Quality key factors stock-summary

Factor
Value
Sales Growth (5y)
17.00%
EBIT Growth (5y)
9.64%
EBIT to Interest (avg)
24.63
Debt to EBITDA (avg)
0.56
Net Debt to Equity (avg)
-0.03
Sales to Capital Employed (avg)
2.33
Tax Ratio
24.25%
Dividend Payout Ratio
21.25%
Pledged Shares
0
Institutional Holding
35.25%
ROCE (avg)
18.91%
ROE (avg)
14.16%

Valuation key factors

Factor
Value
P/E Ratio
40
Industry P/E
43
Price to Book Value
6.37
EV to EBIT
31.04
EV to EBITDA
25.33
EV to Capital Employed
6.55
EV to Sales
2.39
PEG Ratio
1.25
Dividend Yield
0.43%
ROCE (Latest)
18.23%
ROE (Latest)
13.68%

Technicals key factors

Indicator
Weekly
Monthly
MACD
Bullish
Bearish
RSI
No Signal
No Signal
Bollinger Bands
Bullish
Sideways
Moving Averages
Mildly Bearish (Daily)
KST
Mildly Bullish
Bearish
Dow Theory
Mildly Bullish
Mildly Bullish
OBV
Mildly Bearish
No Trend
stock-summary Technical Indicator Scale: Bearish, Mildly Bearish, Sideways, Mildly Bullish, Bullish  Turned 
stock-summaryShareholding
Shareholding Snapshot : Jun 2026stock-summary
Shareholding Compare (%holding) stock-summary
Majority shareholders

Promoters

Pledged Promoter Holdings

None

Mutual Funds

Held by 11 Schemes (23.11%)

FIIs

Held by 117 FIIs (12.01%)

Promoter with highest holding

Mithun Kochouseph Chittilappilly (19.78%)

Highest Public shareholder

Icici Prudential Multi-asset Fund (7.64%)

Individual Investors Holdings

7.15%

stock-summaryFinancial
[
  {
    "link": "quarterly",
    "btn_text": "All Quarterly Results",
    "header": "Quarterly Results Snapshot (Consolidated) - Jun'26 - QoQ",
    "rhs": [
      {
        "prefix": "Net Sales ",
        "suffix": "QoQ Growth in quarter ended Jun 2026 is 3.16% vs 25.06% in Mar 2026",
        "dir": -1
      },
      {
        "prefix": "Consolidated Net Profit ",
        "suffix": "QoQ Growth in quarter ended Jun 2026 is 16.16% vs 96.51% in Mar 2026",
        "dir": -1
      }
    ],
    "table": {
      "header": [
        "Jun'26",
        "Mar'26",
        "Change(%)"
      ],
      "body": [
        {
          "field": "Net Sales",
          "val1": "1,810.65",
          "val2": "1,755.27",
          "chgp": "3.16%",
          "chgp_class": "positive"
        },
        {
          "field": "Operating Profit (PBDIT) excl Other Income",
          "val1": "190.96",
          "val2": "170.72",
          "chgp": "11.86%",
          "chgp_class": "positive"
        },
        {
          "field": "Interest",
          "val1": "3.11",
          "val2": "3.01",
          "chgp": "3.32%",
          "chgp_class": "negative"
        },
        {
          "field": "Exceptional Items",
          "val1": "0.00",
          "val2": "0.00",
          "chgp": "",
          "chgp_class": "neutral"
        },
        {
          "field": "Consolidate Net Profit",
          "val1": "130.25",
          "val2": "112.13",
          "chgp": "16.16%",
          "chgp_class": "positive"
        },
        {
          "field": "Operating Profit Margin (Excl OI)",
          "val1": "10.55%",
          "val2": "9.73%",
          "chgp": "0.82%",
          "chgp_class": "positive"
        }
      ]
    }
  },
  {
    "link": "half-yearly",
    "btn_text": "All Half Yearly Results",
    "header": "Half Yearly Results Snapshot (Consolidated) - Sep'25",
    "rhs": [
      {
        "prefix": "Net Sales ",
        "suffix": " Growth in half year ended Sep 2025 is 1.30% vs 17.99% in Sep 2024",
        "dir": -1
      },
      {
        "prefix": "Consolidated Net Profit ",
        "suffix": " Growth in half year ended Sep 2025 is -14.30% vs 31.82% in Sep 2024",
        "dir": -1
      }
    ],
    "table": {
      "header": [
        "Sep'25",
        "Sep'24",
        "Change(%)"
      ],
      "body": [
        {
          "field": "Net Sales",
          "val1": "2,807.00",
          "val2": "2,771.09",
          "chgp": "1.30%",
          "chgp_class": "positive"
        },
        {
          "field": "Operating Profit (PBDIT) excl Other Income",
          "val1": "232.85",
          "val2": "266.03",
          "chgp": "-12.47%",
          "chgp_class": "negative"
        },
        {
          "field": "Interest",
          "val1": "6.40",
          "val2": "16.17",
          "chgp": "-60.42%",
          "chgp_class": "positive"
        },
        {
          "field": "Exceptional Items",
          "val1": "0.00",
          "val2": "0.00",
          "chgp": "",
          "chgp_class": "neutral"
        },
        {
          "field": "Consolidate Net Profit",
          "val1": "139.14",
          "val2": "162.36",
          "chgp": "-14.30%",
          "chgp_class": "negative"
        },
        {
          "field": "Operating Profit Margin (Excl OI)",
          "val1": "8.30%",
          "val2": "9.60%",
          "chgp": "-1.30%",
          "chgp_class": "negative"
        }
      ]
    }
  },
  {
    "link": "nine-monthly",
    "btn_text": "All Nine Monthly Results",
    "header": "Nine Monthly Results Snapshot (Consolidated) - Dec'25",
    "rhs": [
      {
        "prefix": "Net Sales ",
        "suffix": "YoY Growth in nine months ended Dec 2025 is 4.23% vs 14.96% in Dec 2024",
        "dir": -1
      },
      {
        "prefix": "Consolidated Net Profit ",
        "suffix": "YoY Growth in nine months ended Dec 2025 is -11.85% vs 22.69% in Dec 2024",
        "dir": -1
      }
    ],
    "table": {
      "header": [
        "Dec'25",
        "Dec'24",
        "Change(%)"
      ],
      "body": [
        {
          "field": "Net Sales",
          "val1": "4,210.51",
          "val2": "4,039.74",
          "chgp": "4.23%",
          "chgp_class": "positive"
        },
        {
          "field": "Operating Profit (PBDIT) excl Other Income",
          "val1": "356.04",
          "val2": "370.17",
          "chgp": "-3.82%",
          "chgp_class": "negative"
        },
        {
          "field": "Interest",
          "val1": "9.37",
          "val2": "21.96",
          "chgp": "-57.33%",
          "chgp_class": "positive"
        },
        {
          "field": "Exceptional Items",
          "val1": "-22.11",
          "val2": "0.00",
          "chgp": "",
          "chgp_class": "neutral"
        },
        {
          "field": "Consolidate Net Profit",
          "val1": "196.20",
          "val2": "222.58",
          "chgp": "-11.85%",
          "chgp_class": "negative"
        },
        {
          "field": "Operating Profit Margin (Excl OI)",
          "val1": "8.46%",
          "val2": "9.16%",
          "chgp": "-0.70%",
          "chgp_class": "negative"
        }
      ]
    }
  },
  {
    "link": "annual",
    "btn_text": "All Annual Results",
    "header": "Annual Results Snapshot (Consolidated) - Mar'26",
    "rhs": [
      {
        "prefix": "Net Sales ",
        "suffix": "YoY Growth in year ended Mar 2026 is 6.96% vs 14.85% in Mar 2025",
        "dir": -1
      },
      {
        "prefix": "Consolidated Net Profit ",
        "suffix": "YoY Growth in year ended Mar 2026 is -1.72% vs 21.80% in Mar 2025",
        "dir": -1
      }
    ],
    "table": {
      "header": [
        "Mar'26",
        "Mar'25",
        "Change(%)"
      ],
      "body": [
        {
          "field": "Net Sales",
          "val1": "5,965.78",
          "val2": "5,577.82",
          "chgp": "6.96%",
          "chgp_class": "positive"
        },
        {
          "field": "Operating Profit (PBDIT) excl Other Income",
          "val1": "526.76",
          "val2": "513.23",
          "chgp": "2.64%",
          "chgp_class": "positive"
        },
        {
          "field": "Interest",
          "val1": "12.38",
          "val2": "24.51",
          "chgp": "-49.49%",
          "chgp_class": "positive"
        },
        {
          "field": "Exceptional Items",
          "val1": "-22.11",
          "val2": "0.00",
          "chgp": "",
          "chgp_class": "neutral"
        },
        {
          "field": "Consolidate Net Profit",
          "val1": "308.33",
          "val2": "313.72",
          "chgp": "-1.72%",
          "chgp_class": "negative"
        },
        {
          "field": "Operating Profit Margin (Excl OI)",
          "val1": "8.83%",
          "val2": "9.20%",
          "chgp": "-0.37%",
          "chgp_class": "negative"
        }
      ]
    }
  }
]

Quarterly Results Snapshot (Consolidated) - Jun'26 - QoQstock-summary

Jun'26
Mar'26
Change(%)
Net Sales
1,810.65
1,755.27
3.16%
Operating Profit (PBDIT) excl Other Income
190.96
170.72
11.86%
Interest
3.11
3.01
3.32%
Exceptional Items
0.00
0.00
Consolidate Net Profit
130.25
112.13
16.16%
Operating Profit Margin (Excl OI)
10.55%
9.73%
0.82%
Values in Rs Cr.
Direction Arrows
Net Sales

QoQ Growth in quarter ended Jun 2026 is 3.16% vs 25.06% in Mar 2026

Direction Arrows
Consolidated Net Profit

QoQ Growth in quarter ended Jun 2026 is 16.16% vs 96.51% in Mar 2026

Half Yearly Results Snapshot (Consolidated) - Sep'25stock-summary

Sep'25
Sep'24
Change(%)
Net Sales
2,807.00
2,771.09
1.30%
Operating Profit (PBDIT) excl Other Income
232.85
266.03
-12.47%
Interest
6.40
16.17
-60.42%
Exceptional Items
0.00
0.00
Consolidate Net Profit
139.14
162.36
-14.30%
Operating Profit Margin (Excl OI)
8.30%
9.60%
-1.30%
Values in Rs Cr.
Direction Arrows
Net Sales

Growth in half year ended Sep 2025 is 1.30% vs 17.99% in Sep 2024

Direction Arrows
Consolidated Net Profit

Growth in half year ended Sep 2025 is -14.30% vs 31.82% in Sep 2024

Nine Monthly Results Snapshot (Consolidated) - Dec'25stock-summary

Dec'25
Dec'24
Change(%)
Net Sales
4,210.51
4,039.74
4.23%
Operating Profit (PBDIT) excl Other Income
356.04
370.17
-3.82%
Interest
9.37
21.96
-57.33%
Exceptional Items
-22.11
0.00
Consolidate Net Profit
196.20
222.58
-11.85%
Operating Profit Margin (Excl OI)
8.46%
9.16%
-0.70%
Values in Rs Cr.
Direction Arrows
Net Sales

YoY Growth in nine months ended Dec 2025 is 4.23% vs 14.96% in Dec 2024

Direction Arrows
Consolidated Net Profit

YoY Growth in nine months ended Dec 2025 is -11.85% vs 22.69% in Dec 2024

Annual Results Snapshot (Consolidated) - Mar'26stock-summary

Mar'26
Mar'25
Change(%)
Net Sales
5,965.78
5,577.82
6.96%
Operating Profit (PBDIT) excl Other Income
526.76
513.23
2.64%
Interest
12.38
24.51
-49.49%
Exceptional Items
-22.11
0.00
Consolidate Net Profit
308.33
313.72
-1.72%
Operating Profit Margin (Excl OI)
8.83%
9.20%
-0.37%
Values in Rs Cr.
Direction Arrows
Net Sales

YoY Growth in year ended Mar 2026 is 6.96% vs 14.85% in Mar 2025

Direction Arrows
Consolidated Net Profit

YoY Growth in year ended Mar 2026 is -1.72% vs 21.80% in Mar 2025

stock-summaryCompany CV
About V-Guard Industries Ltd stock-summary
stock-summary
V-Guard Industries Ltd
Small Cap
Electronics & Appliances
V-Guard Industries Limited based in Kochi, Kerala is a multi-product company catering to the mass consumption market. The Company is engaged in manufacturing, trading and selling of a wide range of Electronics, Electrical and Consumer Durables. Its manufacturing facilities are located at Coimbatore, Tamil Nadu; at Kashipur and Roorkee, Uttarakhand; at Kala Amb, Himachal Pradesh; at SIPCOT Industrial Growth Center, Perundurai, Tamil Nadu and at Majitar, Rangpo and Mamring in Sikkim.
Company Coordinates stock-summary
Company Details
No 42/962 Vennala High, School Road Vennala Kochi Kerala : 682028
stock-summary
Tel: 91-0484-3005000
stock-summary
mail@vguard.in
Registrar Details
Link Intime India Pvt Ltd, Coimbatore Branch Surya , 35 Mayflower Avenue, Behind Senthil Nagar, Sowripalayam Road, Coimbatore