
Compare Vinati Organics with Similar Stocks
Stock DNA
Specialty Chemicals
INR 14,677 Cr (Small Cap)
32.00
43
0.54%
-0.04
14.85%
4.89
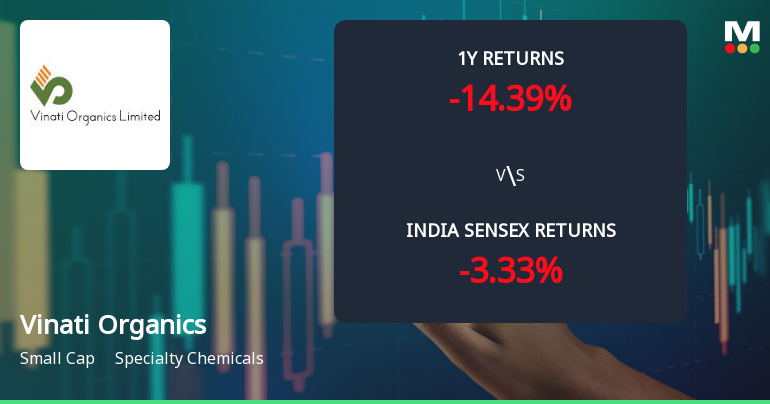
Total Returns (Price + Dividend) 
Latest dividend: 7.5 per share ex-dividend date: Sep-19-2025
Risk Adjusted Returns v/s
Returns Beta

News
Vinati Organics Ltd Technical Momentum Shifts Amid Mixed Market Signals
Vinati Organics Ltd, a small-cap player in the specialty chemicals sector, has experienced a notable shift in its technical momentum, reflecting a complex interplay of bullish and bearish signals across multiple timeframes. Despite a recent 3.5% gain in daily price, the company’s overall technical grade has been downgraded to Sell, signalling caution for investors amid mixed indicator readings and a challenging broader market backdrop.
Read full news article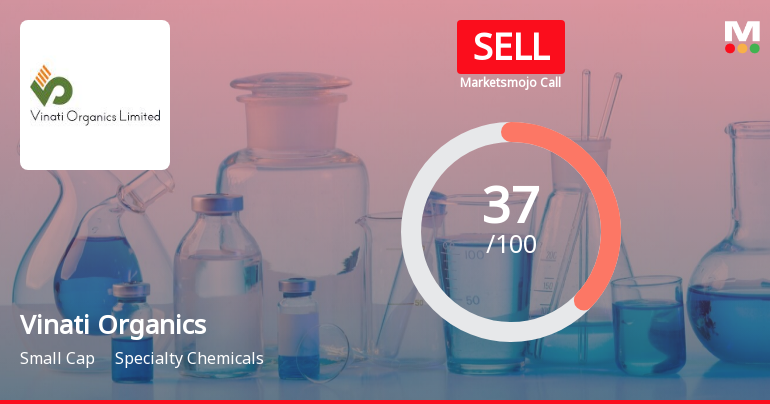
Vinati Organics Ltd is Rated Sell
Vinati Organics Ltd is rated 'Sell' by MarketsMOJO, with this rating last updated on 06 Oct 2025. However, the analysis and financial metrics discussed here reflect the company’s current position as of 30 April 2026, providing investors with the latest insights into its performance and outlook.
Read full news article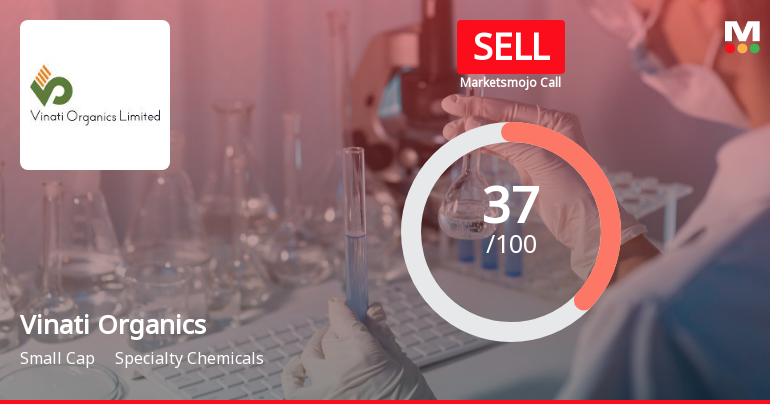
Vinati Organics Ltd is Rated Sell
Vinati Organics Ltd is rated 'Sell' by MarketsMOJO, with this rating last updated on 06 Oct 2025. However, the analysis and financial metrics discussed here reflect the stock's current position as of 19 April 2026, providing investors with an up-to-date view of the company’s performance and outlook.
Read full news article Announcements
Vinati Organics Limited - Press Release
26-Nov-2019 | Source : NSEVinati Organics Limited has informed the Exchange regarding a press release dated November 26, 2019, titled "Intimation of Newspaper advertisement with respect to Postal Ballot Notice".
Vinati Organics Limited - Outcome of Board Meeting
13-Nov-2019 | Source : NSEVinati Organics Limited has informed the Exchange regarding Board meeting held on November 12, 2019.
Vinati Organics Limited - Press Release
22-Oct-2019 | Source : NSEVinati Organics Limited has informed the Exchange regarding a press release dated October 19, 2019, titled "Press Release Reg 47".
Corporate Actions

12 May 2026

Vinati Organics Ltd has declared 750% dividend, ex-date: 19 Sep 25

Vinati Organics Ltd has announced 1:2 stock split, ex-date: 05 Feb 20

Vinati Organics Ltd has announced 1:2 bonus issue, ex-date: 22 Nov 07

No Rights history available
Quality key factors
Valuation key factors
Technicals key factors
 Technical Indicator Scale: Bearish, Mildly Bearish, Sideways, Mildly Bullish, Bullish Turned
 Shareholding Snapshot : Mar 2026
Shareholding Compare (%holding)
Promoters
None
Held by 12 Schemes (9.05%)
Held by 99 FIIs (3.72%)
Suchir Chemicals Private Limited (45.87%)
Canara Robeco Mutual Fund A/c Canara Robeco Multi Cap Fund (2.99%)
9.67%
Quarterly Results Snapshot (Consolidated) - Dec'25 - QoQ

QoQ Growth in quarter ended Dec 2025 is -3.53% vs 1.52% in Sep 2025
QoQ Growth in quarter ended Dec 2025 is -12.23% vs 10.26% in Sep 2025
Half Yearly Results Snapshot (Consolidated) - Sep'25
Growth in half year ended Sep 2025 is 1.31% vs 19.56% in Sep 2024
Growth in half year ended Sep 2025 is 16.21% vs 32.88% in Sep 2024
Nine Monthly Results Snapshot (Consolidated) - Dec'25
YoY Growth in nine months ended Dec 2025 is 1.45% vs 18.53% in Dec 2024
YoY Growth in nine months ended Dec 2025 is 13.36% vs 28.98% in Dec 2024
Annual Results Snapshot (Consolidated) - Mar'25

YoY Growth in year ended Mar 2025 is 18.33% vs -8.34% in Mar 2024
YoY Growth in year ended Mar 2025 is 25.47% vs -22.95% in Mar 2024
About Vinati Organics Ltd

Company Coordinates


