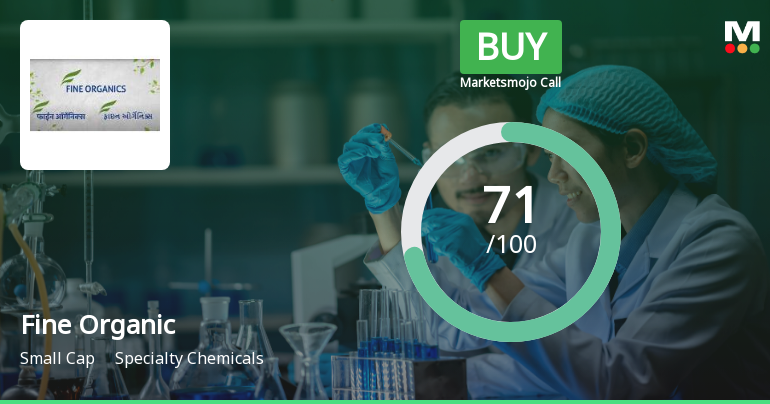
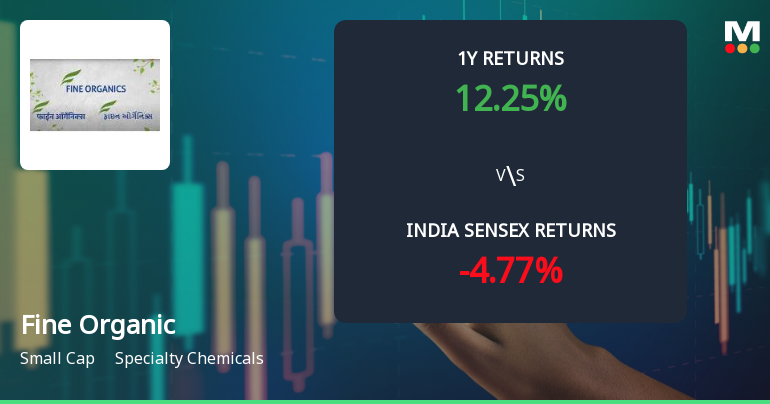
Fine Organic

  • Market Cap: Small Cap
  • Industry: Specialty Chemicals
  • ISIN: INE686Y01026
  • NSEID: FINEORG
  • BSEID: 541557
INR
5,186.00
39.5 (0.77%)
BSENSE

Sep 03, 11:47 AM

BSE+NSE Vol: 7.79 k

  • Price Points
  • Score
  • Mojo Parameters
  • Total Return
  • News and Corporate Actions
  • Key factors
  • Shareholding
  • Financials
  • CompanyCV
stock-summaryPrice Point
High/Low

1Day

52 Week

Valuation
Technical
Day's Volume

CASH

7.79 k (-45.43%) Volume

Shareholding (Jun 2026)

FII

4.28%

Held by 106 FIIs

DII

11.72%

Held by 15 DIIs

Promoter

75.00%

Why is Fine Organic Industries Ltd falling/rising?

03-Sep-2026

As of 02-Sep, Fine Organic Industries Ltd's stock price is Rs 5,145.20, down 1.95% and part of a three-day decline totaling 2.66%. Despite a strong ROE and being net-debt free, the stock's high valuation and recent performance suggest cautious investor sentiment.

As of 02-Sep, Fine Organic Industries Ltd's stock price is falling, currently at Rs 5,145.20, reflecting a decrease of Rs 102.55 or 1.95%. This decline is part of a broader trend, as the stock has been losing value for the past three days, accumulating a total drop of 2.66% during this period. Additionally, the stock underperformed its sector by 1.55% today.<BR><BR>Despite some positive indicators, such as a high return on equity (ROE) of 24.40% and being net-debt free, the stock's valuation appears expensive with a price-to-book value of 5.9, which is higher than its peers' average historical valuations. Furthermore, while the stock has shown a year-to-date increase of 25.02%, its profits have only risen by 7.1%, leading to a high price/earnings to growth (PEG) ratio of 5.1, which may deter some investors.<BR><BR>The stock's performance relative to the benchmark Sensex also reflects a challenging environment, with the Sensex down 1.17% over the past week, while Fine Organic Industries Ltd managed a slight gain of 0.12%. However, the overall market sentiment and the stock's recent consecutive declines suggest that investors may be cautious, contributing to the current downward movement in its price.

View full answer

Who are in the management team of Fine Organic?

01-Sep-2026

The management team of Fine Organic includes Mukesh Maganlal Shah (Chairman & Managing Director), Jayen Ramesh Shah (CEO), Tushar Ramesh Shah (CFO), Bimal Mukesh Shah, and Nikhil Dattatraya Kamat as executive directors, along with several independent directors guiding the company's strategy.

The management team of Fine Organic includes the following key individuals:<BR><BR>1. **Mukesh Maganlal Shah** - Chairman & Managing Director<BR>2. **Jayen Ramesh Shah** - Executive Director, Whole-Time Director, CEO, and Promoter<BR>3. **Tushar Ramesh Shah** - Executive Director, Whole-Time Director, CFO, and Promoter<BR>4. **Bimal Mukesh Shah** - Whole-Time Director & Executive Director<BR>5. **Nikhil Dattatraya Kamat** - Executive Director<BR><BR>Additionally, the board features several independent directors:<BR><BR>1. **Prakash Apte** - Independent Director<BR>2. **Kaushik Dwarkadas Shah** - Independent Director<BR>3. **Mahesh Pansukhlal Sarda** - Independent Director<BR>4. **Thiruvengadam P** - Independent Director<BR>5. **Pratima Madhukar Umarji** - Independent Director<BR><BR>This team plays a crucial role in guiding the company's strategic direction and operations.

View full answer

What does Fine Organic do?

01-Sep-2026

Fine Organic Industries Ltd is India's largest producer of oleochemical-based additives in the specialty chemicals sector, with a market cap of INR 16,005 Cr and reported net sales of 694 Cr and net profit of 138 Cr for June 2026. The company has a P/E ratio of 36.00 and a return on equity of 15.46%.

Overview: <BR>Fine Organic Industries Ltd is a pioneer and the largest producer of oleochemical-based additives in India, operating in the specialty chemicals industry within the small-cap market.<BR><BR>History: <BR>Fine Organic Industries was incorporated in an unspecified year and has maintained its status as a leading producer. The latest quarterly results reported are for June 2026, showcasing significant sales and profit figures.<BR><BR>Financial Snapshot: <BR>- Net Sales: 694 Cr (Quarterly Results - Jun 2026) <BR>- Net Profit: 138 Cr (Quarterly Results - Jun 2026) <BR>- Market Cap: INR 16,005 Cr (Small Cap) <BR><BR>Key Metrics: <BR>- P/E: 36.00 <BR>- Industry P/E: 43 <BR>- Dividend Yield: 0.21% <BR>- Debt-Equity: -0.52 <BR>- Return on Equity: 15.46% <BR>- Price to Book: 6.08 <BR><BR>Contact Details: <BR>Address: Fine House Anandji Street, Off M G Road Ghatkopar East Mumbai Maharashtra : 400077 <BR>Tel: 91-022-2102 5000 <BR>Email: investors@fineorganics.com <BR>Website: http://www.fineorganics.com

View full answer

Who are the peers of the Fine Organic?

01-Sep-2026

Fine Organic's peers include Deepak Nitrite, Aether Industries, Aarti Industries, Atul, BASF India, Anupam Rasayan, Vinati Organics, Privi Speciality, and Jubilant Ingrevia. Management risk varies from excellent to below average among peers, with Aether Industries showing the highest 1-year return at 130.07%, while BASF India has the lowest at -17.84%.

Peers: The peers of Fine Organic are Deepak Nitrite, Aether Industri., Aarti Industries, Atul, BASF India, Anupam Rasayan, Vinati Organics, Privi Speci., and Jubilant Ingrev.<BR><BR>Quality Snapshot: Excellent management risk is observed at Fine Organic, Deepak Nitrite, Atul, BASF India, Vinati Organics, and Privi Speci., while Average management risk is found at Aether Industri. and Aarti Industries. Below Average management risk is noted for Anupam Rasayan. In terms of Growth, Good growth is seen at Privi Speci., while Average growth is found at Fine Organic and Aether Industri., and Below Average growth is noted for Deepak Nitrite, Aarti Industries, Atul, BASF India, Anupam Rasayan, and Vinati Organics. Excellent capital structure is present at Fine Organic, Deepak Nitrite, Atul, BASF India, and Vinati Organics, while Average capital structure is observed at Anupam Rasayan, and Below Average capital structure is noted for Aarti Industries and Privi Speci.<BR><BR>Return Snapshot: Aether Industri. has the highest 1-year return at 130.07%, while BASF India has the lowest at -17.84%. Fine Organic's 1-year return of 12.19% is better than BASF India but lower than Aether Industri. Additionally, the six-month return is negative for Vinati Organics and BASF India.

View full answer

How big is Fine Organic?

01-Sep-2026

As of 31st August, Fine Organic Industries Ltd has a market capitalization of 16,005.00 Cr, with recent net sales of 2,471.58 Cr and a net profit of 438.10 Cr.

As of 31st August, Fine Organic Industries Ltd has a market capitalization of 16,005.00 Cr, categorizing it as a Small Cap company.<BR><BR>In the latest 4 quarters, Fine Organic reported Net Sales of 2,471.58 Cr and a Net Profit of 438.10 Cr.<BR><BR>The latest reporting period for the balance sheet is March 2026, with Shareholder's Funds amounting to 2,664.52 Cr and Total Assets of 2,963.98 Cr.

View full answer

Should I buy, sell or hold Fine Organic Industries Ltd?

01-Sep-2026

Are Fine Organic Industries Ltd latest results good or bad?

20-May-2026

Fine Organic Industries Ltd's latest results show strong sequential recovery with a 58.92% increase in net profit and record quarterly revenue, but year-on-year growth is modest at 3.05%, and declining operating margins indicate ongoing profitability challenges. Investors should consider these mixed signals when evaluating the company's performance.

Fine Organic Industries Ltd's latest results for the March 2026 quarter show a mixed picture. On one hand, the company experienced a strong sequential recovery, with net profit increasing by 58.92% quarter-on-quarter to ₹117.49 crores and revenue rising by 12.71% to ₹625.32 crores. This marks the highest quarterly revenue in the company's history, indicating a positive momentum after a challenging December quarter.<BR><BR>However, when looking at the year-on-year performance, the situation is more cautious. Revenue growth of just 3.05% compared to the same quarter last year, coupled with operating margins that have significantly declined from previous highs, raises concerns about ongoing profitability pressures. The operating margin for Q4 FY26 was 20.76%, down from 25.30% in September 2024, reflecting challenges in managing raw material costs and pricing power.<BR><BR>Overall, while the sequential improvement is encouraging, the persistent margin compression and decelerating growth suggest that Fine Organic is facing structural challenges. Investors may need to weigh these factors carefully when assessing the company's performance and future prospects.

View full answer

When is the next results date for Fine Organic Industries Ltd?

06-May-2026

The next results date for Fine Organic Industries Ltd is 19 May 2026.

The next results date for Fine Organic Industries Ltd is scheduled for 19 May 2026.

View full answer

Is Fine Organic technically bullish or bearish?

02-Dec-2025

As of December 1, 2025, Fine Organic's technical trend has shifted to a bearish outlook, supported by negative MACD readings, bearish Bollinger Bands, and moving averages, indicating significant weakness.

As of 1 December 2025, the technical trend has changed from mildly bearish to bearish. The current stance is bearish with a strong indication of weakness. Key indicators driving this stance include bearish MACD readings on both the weekly and monthly time frames, bearish Bollinger Bands, and bearish moving averages on the daily chart. The KST also shows bearish signals in both weekly and monthly analyses. The Dow Theory reflects a mildly bearish trend on the weekly but indicates no trend on the monthly. Overall, the combination of these indicators suggests a significant bearish outlook for Fine Organic.

View full answer

How has been the historical performance of Fine Organic?

24-Nov-2025

Fine Organic's historical performance shows fluctuating net sales and profits, with net sales of 2,269.15 Cr in March 2025, down from a peak of 3,023.08 Cr in March 2023, and a decline in profit metrics compared to previous years. Operating cash flow also decreased significantly, resulting in a net cash outflow of 505.00 Cr in March 2025.

Answer:<BR>The historical performance of Fine Organic shows a fluctuating trend in net sales and profits over the past several years, with a notable decline in recent periods.<BR><BR>Breakdown:<BR>Fine Organic's net sales reached 2,269.15 Cr in March 2025, up from 2,122.95 Cr in March 2024, but down from a peak of 3,023.08 Cr in March 2023. The total operating income followed a similar pattern, with 2,269.15 Cr in March 2025 compared to 2,122.95 Cr in March 2024 and 3,023.08 Cr in March 2023. The company's total expenditure, excluding depreciation, was 1,756.27 Cr in March 2025, an increase from 1,588.47 Cr in March 2024, but lower than 2,192.00 Cr in March 2023. Operating profit (PBDIT) for March 2025 was 610.48 Cr, slightly up from 606.36 Cr in March 2024, but down from 895.23 Cr in March 2023. Profit before tax was 555.99 Cr in March 2025, a marginal increase from 546.76 Cr in March 2024, but significantly lower than 842.76 Cr in March 2023. Profit after tax for March 2025 was 411.33 Cr, slightly down from 414.53 Cr in March 2024 and down from 619.87 Cr in March 2023. The total assets of Fine Organic increased to 2,495.37 Cr in March 2025 from 2,094.49 Cr in March 2024, while total liabilities also rose to 2,495.37 Cr in March 2025 from 2,094.49 Cr in March 2024. The cash flow from operating activities decreased to 204.00 Cr in March 2025 from 634.00 Cr in March 2024, contributing to a net cash outflow of 505.00 Cr in March 2025, compared to a net inflow of 180.00 Cr in March 2024.

View full answer

Who are the top shareholders of the Fine Organic?

17-Jul-2025

The top shareholders of Fine Organic include Tushar Ramesh Shah with 16.26%, mutual funds with 10.84%, foreign institutional investors at 4.66%, and Axis Mutual Fund Trustee Limited as the highest public shareholder at 4.1%. Individual investors hold 7.07% of the shares.

The top shareholders of Fine Organic include the promoters, who hold the majority of the shares. The promoter with the highest holding is Tushar Ramesh Shah, owning 16.26% of the company. Additionally, mutual funds collectively hold 10.84% through 18 schemes, while foreign institutional investors (FIIs) hold 4.66% across 118 entities. The highest public shareholder is Axis Mutual Fund Trustee Limited, which holds 4.1%. Individual investors account for 7.07% of the shareholding.

View full answer

Has Fine Organic declared dividend?

06-Jun-2025

Yes, Fine Organic Industries Ltd has declared a 200% dividend, amounting to ₹10 per share, with an ex-date of August 13, 2024. While recent total returns show volatility, long-term performance over 4 and 5 years indicates significant growth.

Fine Organic Industries Ltd has declared a 200% dividend.<BR><BR>Dividend Details:<BR>- Percentage announced: 200%<BR>- Amount per share: 10<BR>- Ex-date: 13 Aug 24<BR><BR>Dividend Yield: 0.21%.<BR><BR>Total Returns by Period:<BR>In the last 6 months, the price return was -6.44%, with no dividend return, resulting in a total return of -6.44%.<BR><BR>Over the past year, the price return was 7.65%, with a dividend return of 0.21%, leading to a total return of 7.86%.<BR><BR>In the 2-year period, the price return was -2.99%, with a dividend return of 0.39%, resulting in a total return of -2.6%.<BR><BR>For the 3-year period, the price return was -7.04%, with a dividend return of 0.59%, culminating in a total return of -6.45%.<BR><BR>In the last 4 years, the price return was 59.83%, with a dividend return of 1.14%, producing a total return of 60.97%.<BR><BR>Over the 5-year period, the price return was 133.04%, with a dividend return of 1.93%, resulting in a total return of 134.97%.<BR><BR>Overall, Fine Organic has declared a substantial dividend, and while the recent total returns show some volatility, the long-term returns indicate significant growth, particularly over the 4 and 5-year periods.

View full answer
iScoreScore
Click here to find our call on this stock
Strong Sell
Sell
Hold
Buy
Strong Buy

Dashboard

1

High Management Efficiency with a high ROE of 24.40%

 
2

The company is Net-Debt Free

 
3

Positive results in Jun 26

4

Majority shareholders : Promoters

 
stock-summaryMojo Parameters

Mojo Parameters

Loading Valuation Snapshot...

Stock DNA

stock-summary
Industry

Specialty Chemicals

stock-summary
Market cap

INR 15,900 Cr (Small Cap)

stock-summary
P/E

36.00

stock-summary
Industry P/E

17

stock-summary
Dividend Yield

0.21%

stock-summary
Debt Equity

-0.52

stock-summary
Return on Equity

15.46%

stock-summary
Price to Book

5.91

Revenue and Profits:
Net Sales:
694 Cr
(Quarterly Results - Jun 2026)
Net Profit:
138 Cr
stock-summaryTotal Returns
Total Returns (Price + Dividend) stock-summary
Dividend Yield (0.21%)
TimePeriod
Price Return
Dividend Return
Total Return
3 Months
11.92%
0.23%
12.15%
6 Months
16.09%
0.26%
16.35%
1 Year
6.63%
0.23%
6.86%
2 Years
-4.02%
0.41%
-3.61%
3 Years
7.65%
0.63%
8.28%
4 Years
-15.6%
0.58%
-15.02%
5 Years
69.42%
1.62%
71.04%

Latest dividend: 10.986776928019236 per share ex-dividend date: Jul-31-2026

Risk Adjusted Returns v/s stock-summary
Returns Beta
Icon
Beta has not been calculated since enough price history is not available
stock-summaryNews & Corporate Actions

News

Fine Organic Industries Gains 2.39%: 3 Key Factors Driving the Week

Announcements stock-summary

Fine Organic Industries Limited - Updates

09-Dec-2019 | Source : NSE

Fine Organic Industries Limited has informed the Exchange regarding 'Intimation of change of name of Registrar and Share Transfer Agent'.

Fine Organic Industries Limited - Analysts/Institutional Investor Meet/Con. Call Updates

05-Dec-2019 | Source : NSE

Fine Organic Industries Limited has informed the Exchange regarding Analysts/Institutional Investor Meet/Con. Call Updates

Fine Organic Industries Limited - Analysts/Institutional Investor Meet/Con. Call Updates

03-Dec-2019 | Source : NSE

Fine Organic Industries Limited has informed the Exchange regarding Analysts/Institutional Investor Meet/Con. Call Updates

Corporate Actions stock-summary

stock-summary
BOARD MEETING

No Upcoming Board Meetings

stock-summary
DIVIDEND

Fine Organic Industries Ltd has declared 220% dividend, ex-date: 31 Jul 26

stock-summary
SPLITS

No Splits history available

stock-summary
BONUS

No Bonus history available

stock-summary
RIGHTS

No Rights history available

stock-summaryKey Factors

Quality key factors stock-summary

Factor
Value
Sales Growth (5y)
14.59%
EBIT Growth (5y)
25.43%
EBIT to Interest (avg)
100.00
Debt to EBITDA (avg)
Net Debt is too low
Net Debt to Equity (avg)
-0.52
Sales to Capital Employed (avg)
1.39
Tax Ratio
23.02%
Dividend Payout Ratio
8.22%
Pledged Shares
0
Institutional Holding
16.00%
ROCE (avg)
46.38%
ROE (avg)
24.40%

Valuation key factors

Factor
Value
P/E Ratio
36
Industry P/E
17
Price to Book Value
5.91
EV to EBIT
30.12
EV to EBITDA
26.84
EV to Capital Employed
11.19
EV to Sales
5.81
PEG Ratio
5.08
Dividend Yield
0.21%
ROCE (Latest)
33.22%
ROE (Latest)
15.46%

Technicals key factors

Indicator
Weekly
Monthly
MACD
Bullish
Bullish
RSI
No Signal
No Signal
Bollinger Bands
Mildly Bullish
Mildly Bullish
Moving Averages
Bullish (Daily)
KST
Mildly Bearish
Bullish
Dow Theory
Mildly Bullish
Mildly Bullish
OBV
Mildly Bullish
No Trend
stock-summary Technical Indicator Scale: Bearish, Mildly Bearish, Sideways, Mildly Bullish, Bullish  Turned 
stock-summaryShareholding
Shareholding Snapshot : Jun 2026stock-summary
Shareholding Compare (%holding) stock-summary
Majority shareholders

Promoters

Pledged Promoter Holdings

None

Mutual Funds

Held by 12 Schemes (10.7%)

FIIs

Held by 106 FIIs (4.28%)

Promoter with highest holding

Tushar Ramesh Shah (16.6%)

Highest Public shareholder

Axis Mutual Fund Trustee Limited A/c Axis Mutual F (4.05%)

Individual Investors Holdings

7.58%

stock-summaryFinancial
[
  {
    "link": "quarterly",
    "btn_text": "All Quarterly Results",
    "header": "Quarterly Results Snapshot (Consolidated) - Jun'26 - QoQ",
    "rhs": [
      {
        "prefix": "Net Sales ",
        "suffix": "QoQ Growth in quarter ended Jun 2026 is 11.01% vs 12.71% in Mar 2026",
        "dir": -1
      },
      {
        "prefix": "Consolidated Net Profit ",
        "suffix": "QoQ Growth in quarter ended Jun 2026 is 17.59% vs 58.91% in Mar 2026",
        "dir": -1
      }
    ],
    "table": {
      "header": [
        "Jun'26",
        "Mar'26",
        "Change(%)"
      ],
      "body": [
        {
          "field": "Net Sales",
          "val1": "694.17",
          "val2": "625.32",
          "chgp": "11.01%",
          "chgp_class": "positive"
        },
        {
          "field": "Operating Profit (PBDIT) excl Other Income",
          "val1": "175.95",
          "val2": "129.83",
          "chgp": "35.52%",
          "chgp_class": "positive"
        },
        {
          "field": "Interest",
          "val1": "0.90",
          "val2": "2.71",
          "chgp": "-66.79%",
          "chgp_class": "positive"
        },
        {
          "field": "Exceptional Items",
          "val1": "0.00",
          "val2": "0.00",
          "chgp": "",
          "chgp_class": "neutral"
        },
        {
          "field": "Consolidate Net Profit",
          "val1": "138.14",
          "val2": "117.48",
          "chgp": "17.59%",
          "chgp_class": "positive"
        },
        {
          "field": "Operating Profit Margin (Excl OI)",
          "val1": "25.35%",
          "val2": "20.76%",
          "chgp": "4.59%",
          "chgp_class": "positive"
        }
      ]
    }
  },
  {
    "link": "half-yearly",
    "btn_text": "All Half Yearly Results",
    "header": "Half Yearly Results Snapshot (Consolidated) - Sep'25",
    "rhs": [
      {
        "prefix": "Net Sales ",
        "suffix": " Growth in half year ended Sep 2025 is 3.51% vs 5.32% in Sep 2024",
        "dir": -1
      },
      {
        "prefix": "Consolidated Net Profit ",
        "suffix": " Growth in half year ended Sep 2025 is -2.18% vs 13.56% in Sep 2024",
        "dir": -1
      }
    ],
    "table": {
      "header": [
        "Sep'25",
        "Sep'24",
        "Change(%)"
      ],
      "body": [
        {
          "field": "Net Sales",
          "val1": "1,185.67",
          "val2": "1,145.50",
          "chgp": "3.51%",
          "chgp_class": "positive"
        },
        {
          "field": "Operating Profit (PBDIT) excl Other Income",
          "val1": "258.75",
          "val2": "290.34",
          "chgp": "-10.88%",
          "chgp_class": "negative"
        },
        {
          "field": "Interest",
          "val1": "0.95",
          "val2": "1.05",
          "chgp": "-9.52%",
          "chgp_class": "positive"
        },
        {
          "field": "Exceptional Items",
          "val1": "6.98",
          "val2": "0.00",
          "chgp": "",
          "chgp_class": "neutral"
        },
        {
          "field": "Consolidate Net Profit",
          "val1": "225.65",
          "val2": "230.69",
          "chgp": "-2.18%",
          "chgp_class": "negative"
        },
        {
          "field": "Operating Profit Margin (Excl OI)",
          "val1": "21.82%",
          "val2": "25.35%",
          "chgp": "-3.53%",
          "chgp_class": "negative"
        }
      ]
    }
  },
  {
    "link": "nine-monthly",
    "btn_text": "All Nine Monthly Results",
    "header": "Nine Monthly Results Snapshot (Consolidated) - Dec'25",
    "rhs": [
      {
        "prefix": "Net Sales ",
        "suffix": "YoY Growth in nine months ended Dec 2025 is 4.70% vs 5.47% in Dec 2024",
        "dir": -1
      },
      {
        "prefix": "Consolidated Net Profit ",
        "suffix": "YoY Growth in nine months ended Dec 2025 is -4.40% vs 5.39% in Dec 2024",
        "dir": -1
      }
    ],
    "table": {
      "header": [
        "Dec'25",
        "Dec'24",
        "Change(%)"
      ],
      "body": [
        {
          "field": "Net Sales",
          "val1": "1,740.47",
          "val2": "1,662.34",
          "chgp": "4.70%",
          "chgp_class": "positive"
        },
        {
          "field": "Operating Profit (PBDIT) excl Other Income",
          "val1": "353.11",
          "val2": "393.09",
          "chgp": "-10.17%",
          "chgp_class": "negative"
        },
        {
          "field": "Interest",
          "val1": "1.41",
          "val2": "1.47",
          "chgp": "-4.08%",
          "chgp_class": "positive"
        },
        {
          "field": "Exceptional Items",
          "val1": "6.98",
          "val2": "0.00",
          "chgp": "",
          "chgp_class": "neutral"
        },
        {
          "field": "Consolidate Net Profit",
          "val1": "299.58",
          "val2": "313.38",
          "chgp": "-4.40%",
          "chgp_class": "negative"
        },
        {
          "field": "Operating Profit Margin (Excl OI)",
          "val1": "20.29%",
          "val2": "23.65%",
          "chgp": "-3.36%",
          "chgp_class": "negative"
        }
      ]
    }
  },
  {
    "link": "annual",
    "btn_text": "All Annual Results",
    "header": "Annual Results Snapshot (Consolidated) - Mar'26",
    "rhs": [
      {
        "prefix": "Net Sales ",
        "suffix": "YoY Growth in year ended Mar 2026 is 4.26% vs 6.89% in Mar 2025",
        "dir": -1
      },
      {
        "prefix": "Consolidated Net Profit ",
        "suffix": "YoY Growth in year ended Mar 2026 is 1.60% vs -0.34% in Mar 2025",
        "dir": 1
      }
    ],
    "table": {
      "header": [
        "Mar'26",
        "Mar'25",
        "Change(%)"
      ],
      "body": [
        {
          "field": "Net Sales",
          "val1": "2,365.79",
          "val2": "2,269.15",
          "chgp": "4.26%",
          "chgp_class": "positive"
        },
        {
          "field": "Operating Profit (PBDIT) excl Other Income",
          "val1": "482.94",
          "val2": "512.88",
          "chgp": "-5.84%",
          "chgp_class": "negative"
        },
        {
          "field": "Interest",
          "val1": "4.12",
          "val2": "2.20",
          "chgp": "87.27%",
          "chgp_class": "negative"
        },
        {
          "field": "Exceptional Items",
          "val1": "6.98",
          "val2": "0.00",
          "chgp": "",
          "chgp_class": "neutral"
        },
        {
          "field": "Consolidate Net Profit",
          "val1": "417.07",
          "val2": "410.50",
          "chgp": "1.60%",
          "chgp_class": "positive"
        },
        {
          "field": "Operating Profit Margin (Excl OI)",
          "val1": "20.41%",
          "val2": "22.60%",
          "chgp": "-2.19%",
          "chgp_class": "negative"
        }
      ]
    }
  }
]

Quarterly Results Snapshot (Consolidated) - Jun'26 - QoQstock-summary

Jun'26
Mar'26
Change(%)
Net Sales
694.17
625.32
11.01%
Operating Profit (PBDIT) excl Other Income
175.95
129.83
35.52%
Interest
0.90
2.71
-66.79%
Exceptional Items
0.00
0.00
Consolidate Net Profit
138.14
117.48
17.59%
Operating Profit Margin (Excl OI)
25.35%
20.76%
4.59%
Values in Rs Cr.
Direction Arrows
Net Sales

QoQ Growth in quarter ended Jun 2026 is 11.01% vs 12.71% in Mar 2026

Direction Arrows
Consolidated Net Profit

QoQ Growth in quarter ended Jun 2026 is 17.59% vs 58.91% in Mar 2026

Half Yearly Results Snapshot (Consolidated) - Sep'25stock-summary

Sep'25
Sep'24
Change(%)
Net Sales
1,185.67
1,145.50
3.51%
Operating Profit (PBDIT) excl Other Income
258.75
290.34
-10.88%
Interest
0.95
1.05
-9.52%
Exceptional Items
6.98
0.00
Consolidate Net Profit
225.65
230.69
-2.18%
Operating Profit Margin (Excl OI)
21.82%
25.35%
-3.53%
Values in Rs Cr.
Direction Arrows
Net Sales

Growth in half year ended Sep 2025 is 3.51% vs 5.32% in Sep 2024

Direction Arrows
Consolidated Net Profit

Growth in half year ended Sep 2025 is -2.18% vs 13.56% in Sep 2024

Nine Monthly Results Snapshot (Consolidated) - Dec'25stock-summary

Dec'25
Dec'24
Change(%)
Net Sales
1,740.47
1,662.34
4.70%
Operating Profit (PBDIT) excl Other Income
353.11
393.09
-10.17%
Interest
1.41
1.47
-4.08%
Exceptional Items
6.98
0.00
Consolidate Net Profit
299.58
313.38
-4.40%
Operating Profit Margin (Excl OI)
20.29%
23.65%
-3.36%
Values in Rs Cr.
Direction Arrows
Net Sales

YoY Growth in nine months ended Dec 2025 is 4.70% vs 5.47% in Dec 2024

Direction Arrows
Consolidated Net Profit

YoY Growth in nine months ended Dec 2025 is -4.40% vs 5.39% in Dec 2024

Annual Results Snapshot (Consolidated) - Mar'26stock-summary

Mar'26
Mar'25
Change(%)
Net Sales
2,365.79
2,269.15
4.26%
Operating Profit (PBDIT) excl Other Income
482.94
512.88
-5.84%
Interest
4.12
2.20
87.27%
Exceptional Items
6.98
0.00
Consolidate Net Profit
417.07
410.50
1.60%
Operating Profit Margin (Excl OI)
20.41%
22.60%
-2.19%
Values in Rs Cr.
Direction Arrows
Net Sales

YoY Growth in year ended Mar 2026 is 4.26% vs 6.89% in Mar 2025

Direction Arrows
Consolidated Net Profit

YoY Growth in year ended Mar 2026 is 1.60% vs -0.34% in Mar 2025

stock-summaryCompany CV
About Fine Organic Industries Ltd stock-summary
stock-summary
Fine Organic Industries Ltd
Small Cap
Specialty Chemicals
Fine Organic Industries is a pioneer and the largest producer of oleochemical-based additives in India and a key producer globally. The Company produces a wide range of specialty plant derived oleochemicals-based additives used in the foods, polymers, plastic, cosmetics, personal care, paint, ink, coatings feed nutrition and other specialty application in various industries. It is the first largest producer of to introduce slip additives in India.
Company Coordinates stock-summary
Company Details
Fine House Anandji Street, Off M G Road Ghatkopar East Mumbai Maharashtra : 400077
stock-summary
Tel: 91-022-2102 5000
stock-summary
investors@fineorganics.com
Registrar Details
Karvy Computershare Pvt Ltd., Karvy Selenium, Tower-B Plot No 31 & 32, Survey No 116/22, 115/24, 115/25, Financial District, Nanakramguda, Serilingampally, Mandal Ranga Reddy Dist, Hyderabad