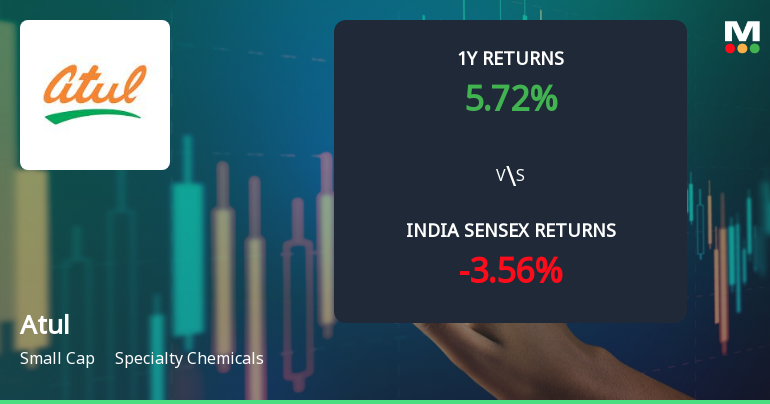
Atul

  • Market Cap: Small Cap
  • Industry: Specialty Chemicals
  • ISIN: INE100A01010
  • NSEID: ATUL
  • BSEID: 500027
INR
6,545.00
59.5 (0.92%)
BSENSE

Sep 03, 10:24 AM

BSE+NSE Vol: 19.73 k

  • Price Points
  • Score
  • Mojo Parameters
  • Total Return
  • News and Corporate Actions
  • Key factors
  • Shareholding
  • Financials
  • CompanyCV
stock-summaryPrice Point
High/Low

1Day

52 Week

Valuation
Technical
Day's Volume

CASH

19.73 k (294.35%) Volume

Shareholding (Jun 2026)

FII

7.44%

Held by 140 FIIs

DII

25.94%

Held by 24 DIIs

Promoter

45.33%

Why is Atul Ltd. falling/rising?

03-Sep-2026

As of 02-Sep, Atul Ltd.'s stock price is rising to 6,484.40, driven by strong financial results and positive market performance, despite concerns over long-term growth potential. The company is net-debt-free, has high operating cash flow, and is trading at a fair valuation compared to peers.

As of 02-Sep, Atul Ltd.'s stock price is rising, currently at 6,484.40, reflecting an increase of 37.2 (0.58%). This upward movement can be attributed to several factors. The stock has outperformed its sector by 0.91% today and has experienced consecutive gains over the last two days, accumulating a total return of 1.22% during this period. Additionally, the company has reported very positive financial results, including a net profit growth of 20.43% and consistent positive results over the last four quarters. <BR><BR>The company's strong financial health is further evidenced by its net-debt-free status and high operating cash flow, which reached Rs 1,022.77 Cr, along with a return on capital employed (ROCE) of 14.33%. The stock is also trading at a discount compared to its peers, with a price-to-book value of 3.1, indicating fair valuation. High institutional holdings at 33.38% suggest confidence from larger investors who typically have better analytical resources.<BR><BR>However, it is important to note that while the stock is currently rising, there are concerns regarding its long-term growth potential, as net sales have only grown at an annual rate of 9.86% and operating profit at 0.53% over the last five years. Despite these risks, the immediate performance indicators and positive financial results are contributing to the stock's current upward trend.

View full answer

Who are in the management team of Atul?

01-Sep-2026

The management team of Atul includes S S Lalbhai (Chairman & Managing Director), S A Lalbhai (Managing Director), B N Mohanan (President & Whole-time Director), T R Gopi Kannan (Whole Time Director & CFO), and several independent directors. Together, they guide the company's strategic direction and operations.

The management team of Atul includes the following key members:<BR><BR>1. **S S Lalbhai** - Chairman & Managing Director<BR>2. **S A Lalbhai** - Managing Director<BR>3. **B N Mohanan** - President & Whole-time Director<BR>4. **T R Gopi Kannan** - Whole Time Director & CFO<BR>5. **R A Shah** - Director<BR>6. **Lalit Patni** - Company Secretary & Compliance Officer<BR><BR>Additionally, there are several independent directors on the board:<BR><BR>1. **S M Datta** - Independent Director<BR>2. **M M Chitale** - Independent Director<BR>3. **Shubhalakshmi Panse** - Independent Director<BR>4. **B R Arora** - Independent Director<BR>5. **Pradeep Banerjee** - Independent Director<BR>6. **Rangaswamy Rathakrishnan Iyer** - Independent Director<BR><BR>This team plays a crucial role in guiding the company's strategic direction and operations.

View full answer

What does Atul do?

01-Sep-2026

Atul Ltd. is a diversified Indian small-cap company in the Specialty Chemicals industry, focusing on Life Science and Performance Chemicals. As of June 2026, it reported net sales of ₹1,848 Cr and a net profit of ₹245 Cr, with a market cap of ₹18,886 Cr.

Overview:<BR>Atul Ltd. is a diversified Indian company engaged in the business of Life Science Chemicals and Performance and Other Chemicals, operating within the Specialty Chemicals industry and categorized as a Small Cap company.<BR><BR>History:<BR>Atul Ltd. was incorporated in an unspecified year and has maintained its status as a diversified company. The latest quarterly results reported are for June 2026, showcasing net sales and profit figures.<BR><BR>Financial Snapshot:<BR>Most recent Net Sales: 1,848 Cr (Quarterly Results - Jun 2026) <BR>Most recent Net Profit: 245 Cr (Quarterly Results - Jun 2026) <BR>Market-cap value: INR 18,886 Cr (Small Cap)<BR><BR>Key Metrics:<BR>P/E: 24.00 <BR>Industry P/E: 43 <BR>Dividend Yield: 0.47% <BR>Debt Equity: -0.25 <BR>Return on Equity: 10.90% <BR>Price to Book: 3.05 <BR><BR>Contact Details:<BR>Address: Atul House, G I Patel Marg Ahmedabad Gujarat : 380014 <BR>Tel: 91-79-26460520/26461294/26463706 <BR>Email: sec@atul.co.in <BR>Website: http://www.atul.co.in

View full answer

Who are the peers of the Atul?

01-Sep-2026

Atul's peers include Navin Fluorine International, Himadri Special, Deepak Nitrite, Aether Industries, Aarti Industries, BASF India, Fine Organic, Anupam Rasayan, and Vinati Organics. Navin Fluorine International shows the best performance with an 85.02% return, while Atul's 1-year return is 1.59%.

Peers: The peers of Atul are Navin Fluo.Intl., Himadri Special, Deepak Nitrite, Aether Industri., Aarti Industries, BASF India, Fine Organic, Anupam Rasayan, and Vinati Organics.<BR><BR>Quality Snapshot: Excellent management risk is observed at Navin Fluo.Intl., Himadri Special, BASF India, and Vinati Organics, while Good management risk is found at Atul, Deepak Nitrite, and Aether Industri. Average management risk is noted for Aether Industri. and Aarti Industries, and Below Average management risk is present at Anupam Rasayan. Growth is Excellent for Navin Fluo.Intl. and Himadri Special, while Below Average growth is seen at Atul, Deepak Nitrite, Aarti Industries, BASF India, and Vinati Organics. Average growth is observed at Aether Industri. and Fine Organic, while Below Average growth is noted for Anupam Rasayan. Capital Structure is Excellent for Navin Fluo.Intl., Himadri Special, Deepak Nitrite, Aether Industri., Atul, BASF India, Fine Organic, and Vinati Organics, while Average capital structure is found at Anupam Rasayan, and Below Average at Aarti Industries.<BR><BR>Return Snapshot: The peer with the highest 1-year return is Navin Fluo.Intl. at 85.02%, while BASF India has the lowest return at -17.84%. Atul's 1-year return is 1.59%, which is higher than BASF India's but significantly lower than Navin Fluo.Intl.'s. Additionally, BASF India and Vinati Organics have negative six-month returns.

View full answer

How big is Atul?

01-Sep-2026

As of 31st August, Atul Ltd. has a market capitalization of 18,886.00 Cr, with net sales of 6,643.49 Cr and a net profit of 795.43 Cr over the latest four quarters. The company has shareholder's funds of 6,221.96 Cr and total assets of 7,869.70 Cr.

As of 31st August, Atul Ltd. has a market capitalization of 18,886.00 Cr, categorizing it as a Small Cap company.<BR><BR>In the latest four quarters, Atul Ltd. reported net sales of 6,643.49 Cr and a net profit of 795.43 Cr.<BR><BR>For the latest annual period, Atul Ltd. has shareholder's funds amounting to 6,221.96 Cr and total assets of 7,869.70 Cr.

View full answer

Should I buy, sell or hold Atul Ltd.?

14-Aug-2026

Are Atul Ltd. latest results good or bad?

25-Jul-2026

Atul Ltd.'s latest Q1 FY27 results are strong, with a 91.99% increase in net profit and a 25.03% rise in net sales year-on-year. However, concerns about long-term growth and capital efficiency remain, suggesting caution for investors.

Atul Ltd.'s latest results for Q1 FY27 can be characterized as strong, showcasing significant improvements across several key financial metrics. The company reported a net profit of ₹245.30 crores, which is a remarkable increase of 91.99% year-on-year. Additionally, net sales reached ₹1,847.95 crores, reflecting a year-on-year growth of 25.03% and a sequential increase of 10.65% compared to the previous quarter.<BR><BR>The operating margin also reached a record high of 21.30%, marking the highest quarterly performance in at least seven quarters. This improvement is attributed to enhanced operational efficiency and favorable market conditions, particularly in the Life Science Chemicals and Performance & Other Chemicals segments.<BR><BR>However, while the quarterly performance is impressive, it's important to note that Atul has faced structural challenges in the past, including a five-year contraction in operating profit growth at an annual rate of 1.92%. The return on equity (ROE) stands at 10.90%, which, although an improvement, remains below industry standards for specialty chemicals companies.<BR><BR>In summary, Atul Ltd. has delivered a strong quarterly performance, but ongoing concerns regarding capital efficiency and long-term growth potential should be considered. The results indicate a positive trend, but investors may want to remain cautious about the sustainability of this performance moving forward.

View full answer

Is Atul overvalued or undervalued?

24-Nov-2025

As of November 21, 2025, Atul is fairly valued with a PE Ratio of 32.44 and a PEG Ratio of 0.75, making it a more reasonable investment option in the specialty chemicals sector compared to peers like Solar Industries and Godrej Industries, despite a year-to-date underperformance of -14.15% against the Sensex.

As of 21 November 2025, Atul's valuation grade has moved from expensive to fair, indicating a more favorable assessment of its market position. The company is currently fairly valued based on its financial metrics. Key ratios include a PE Ratio of 32.44, an EV to EBITDA of 17.41, and a PEG Ratio of 0.75, which suggests that the stock may offer growth potential relative to its price.<BR><BR>In comparison with its peers, Atul's valuation stands out against companies like Solar Industries, which is deemed very expensive with a PE of 94.3, and Godrej Industries, which is attractive with a PE of 36.48. This positions Atul as a more reasonable investment option within the specialty chemicals sector. Despite recent underperformance against the Sensex, with a year-to-date return of -14.15% compared to the Sensex's 9.08%, the current valuation reflects a balance of risk and potential reward.

View full answer

Is Atul technically bullish or bearish?

24-Nov-2025

As of November 21, 2025, the technical analysis for Atul indicates a bearish trend, supported by negative signals from MACD, moving averages, KST, and Bollinger Bands, despite a mildly bullish signal from Dow Theory and a bullish OBV divergence.

As of 21 November 2025, the technical trend has changed from mildly bearish to bearish. The current stance is bearish with a strong indication of weakness. The weekly and monthly MACD are both bearish, supporting the overall negative outlook. The daily moving averages also confirm a bearish trend. Although the Dow Theory shows a mildly bullish signal on the weekly timeframe, it is countered by the bearish signals from the KST and Bollinger Bands on both weekly and monthly timeframes. The OBV is bullish on both timeframes, but this divergence does not outweigh the prevailing bearish indicators. Overall, the technical analysis suggests a bearish sentiment for Atul.

View full answer

How has been the historical performance of Atul?

17-Oct-2025

Atul's historical performance shows significant growth in net sales and operating profit, with net sales rising to 5,583.35 Cr in Mar'25 and operating profit increasing to 1,021.99 Cr. However, profit after tax slightly decreased to 487.53 Cr, and cash flow from operating activities declined to 603.00 Cr.

Answer:<BR>The historical performance of Atul shows significant fluctuations in key financial metrics over the years.<BR><BR>Breakdown:<BR>Atul's net sales increased from 4,725.68 Cr in Mar'24 to 5,583.35 Cr in Mar'25, marking a notable growth. Total operating income followed a similar trend, rising to 5,583.35 Cr in Mar'25 from 4,725.68 Cr in the previous year. However, the total expenditure also increased, reaching 4,670.39 Cr in Mar'25 compared to 4,088.99 Cr in Mar'24. Operating profit, excluding other income, rose to 912.96 Cr in Mar'25 from 636.69 Cr in Mar'24, while the overall operating profit increased to 1,021.99 Cr. Profit before tax showed a rise to 681.19 Cr in Mar'25, although profit after tax decreased slightly to 487.53 Cr from 314.42 Cr in the prior year. The earnings per share (EPS) increased to 164.38 in Mar'25 from 109.72 in Mar'24. On the balance sheet, total assets grew to 6,979.58 Cr in Mar'25 from 6,455.03 Cr in Mar'24, while total liabilities also increased to 6,979.58 Cr. The cash flow from operating activities was 603.00 Cr in Mar'25, down from 667.00 Cr in Mar'24, and the net cash outflow was -8.00 Cr in Mar'25, indicating a decline in cash position compared to the previous year.

View full answer

Who are the top shareholders of the Atul?

17-Jul-2025

The top shareholders of Atul include promoters with Aagam Holdings Private Limited holding 22.6%, mutual funds at 12.89%, foreign institutional investors at 8.78%, and individual investors at 16.86%. The Life Insurance Corporation of India is the largest public shareholder with 5.44%.

The top shareholders of Atul include a mix of promoters, mutual funds, foreign institutional investors (FIIs), and individual investors. The majority shareholders are the promoters, with Aagam Holdings Private Limited holding the highest stake at 22.6%. Mutual funds collectively own 12.89% of the company, while FIIs hold 8.78%. The highest public shareholder is the Life Insurance Corporation of India, which owns 5.44%. Additionally, individual investors hold 16.86% of the shares.

View full answer

When is the next results date for Atul?

06-Jun-2025

No Upcoming Board Meetings

Has Atul declared dividend?

06-Jun-2025

Atul Ltd. has declared a 200% dividend, amounting to ₹20 per share, with an ex-date of July 12, 2024. While recent total returns have varied, the company has shown strong long-term performance, achieving a total return of 59.4% over the past five years.

Atul Ltd. has declared a 200% dividend.<BR><BR>Dividend Details:<BR>- Percentage announced: 200%<BR>- Amount per share: 20<BR>- Ex-date: 12 Jul 24<BR><BR>Dividend Yield: 0.28%.<BR><BR>Total Returns by Period:<BR>In the last 6 months, the price return was -0.62%, the dividend return was 0%, resulting in a total return of -0.62%.<BR><BR>Over the past year, the price return was 25.38%, the dividend return was 0.33%, leading to a total return of 25.71%.<BR><BR>In the 2-year period, the price return was 7.97%, the dividend return was 0.64%, culminating in a total return of 8.61%.<BR><BR>For the 3-year period, the price return was -7.96%, the dividend return was 0.98%, resulting in a total return of -6.98%.<BR><BR>In the last 4 years, the price return was -15.23%, the dividend return was 1.09%, leading to a total return of -14.14%.<BR><BR>Finally, over the 5-year period, the price return was 57.24%, the dividend return was 2.16%, resulting in a total return of 59.4%.<BR><BR>Overall, Atul Ltd. has declared a significant dividend, and while the recent total returns show variability, the long-term performance over five years indicates a strong positive return, particularly driven by price appreciation.

View full answer
iScoreScore
Click here to find our call on this stock
Strong Sell
Sell
Hold
Buy
Strong Buy

Dashboard

1

The company is Net-Debt Free

 
2

With a growth in Net Profit of 20.43%, the company declared Very Positive results in Jun 26

3

With ROE of 10.9, it has a Fair valuation with a 3.1 Price to Book Value

4

High Institutional Holdings at 33.38%

stock-summaryMojo Parameters

Mojo Parameters

Loading Valuation Snapshot...

Stock DNA

stock-summary
Industry

Specialty Chemicals

stock-summary
Market cap

INR 19,270 Cr (Small Cap)

stock-summary
P/E

24.00

stock-summary
Industry P/E

43

stock-summary
Dividend Yield

0.46%

stock-summary
Debt Equity

-0.25

stock-summary
Return on Equity

10.90%

stock-summary
Price to Book

3.06

Revenue and Profits:
Net Sales:
1,848 Cr
(Quarterly Results - Jun 2026)
Net Profit:
245 Cr
stock-summaryTotal Returns
Total Returns (Price + Dividend) stock-summary
Dividend Yield (0.46%)
TimePeriod
Price Return
Dividend Return
Total Return
3 Months
-1.66%
0.45%
-1.21%
6 Months
0.21%
0.49%
0.7%
1 Year
2.19%
0.47%
2.66%
2 Years
-17.44%
0.69%
-16.75%
3 Years
-11.01%
1.05%
-9.96%
4 Years
-29.02%
1.20%
-27.82%
5 Years
-29.0%
1.41%
-27.59%

Latest dividend: 30 per share ex-dividend date: Jul-17-2026

Risk Adjusted Returns v/s stock-summary
Returns Beta
Icon
Beta has not been calculated since enough price history is not available
stock-summaryNews & Corporate Actions

News

Atul Ltd. Falls 3.36%: Valuation Reset and Mixed Technical Signals Shape the Week

Announcements stock-summary

Atul Limited - Updates

18-Nov-2019 | Source : NSE

Atul Limited has informed the Exchange regarding 'Newspaper advertisement pursuant to the SEBI Circular No. SEBI/HO/MIRSD/DOS3/CIR/P/2018/139 dated November 06, 2018 '.

Atul Limited - Dividend

25-Oct-2019 | Source : NSE

Atul Limited has informed the Exchange that Board of Directors of the Company at the Meeting held on October 25, 2016 has also approved and declared special interim dividend of Rs 12.50/- (Twelve rupees and fifty paisa) per equity share to commemorate the 125th birth anniversary of the illustrious Founder of the Company, Shri Kasturbhai Lalbhai.

Atul Limited - Record Date

22-Oct-2019 | Source : NSE

Atul Limited has informed the Exchange that the Company has fixed Record Date as November 5, 2019 for the purpose of Special interim dividend.

Corporate Actions stock-summary

stock-summary
BOARD MEETING

No Upcoming Board Meetings

stock-summary
DIVIDEND

Atul Ltd. has declared 300% dividend, ex-date: 17 Jul 26

stock-summary
SPLITS

No Splits history available

stock-summary
BONUS

No Bonus history available

stock-summary
RIGHTS

No Rights history available

stock-summaryKey Factors

Quality key factors stock-summary

Factor
Value
Sales Growth (5y)
9.86%
EBIT Growth (5y)
0.53%
EBIT to Interest (avg)
50.44
Debt to EBITDA (avg)
0.18
Net Debt to Equity (avg)
-0.25
Sales to Capital Employed (avg)
1.01
Tax Ratio
24.23%
Dividend Payout Ratio
13.04%
Pledged Shares
0.97%
Institutional Holding
33.38%
ROCE (avg)
13.69%
ROE (avg)
10.10%

Valuation key factors

Factor
Value
P/E Ratio
24
Industry P/E
43
Price to Book Value
3.06
EV to EBIT
20.08
EV to EBITDA
14.71
EV to Capital Employed
3.75
EV to Sales
2.63
PEG Ratio
0.40
Dividend Yield
0.46%
ROCE (Latest)
15.20%
ROE (Latest)
10.90%

Technicals key factors

Indicator
Weekly
Monthly
MACD
Mildly Bearish
Mildly Bullish
RSI
No Signal
Bullish
Bollinger Bands
Mildly Bearish
Bullish
Moving Averages
Mildly Bullish (Daily)
KST
Bearish
Mildly Bullish
Dow Theory
Mildly Bearish
Mildly Bullish
OBV
No Trend
No Trend
stock-summary Technical Indicator Scale: Bearish, Mildly Bearish, Sideways, Mildly Bullish, Bullish  Turned 
stock-summaryShareholding
Shareholding Snapshot : Jun 2026stock-summary
Shareholding Compare (%holding) stock-summary
Majority shareholders

Promoters

Pledged Promoter Holdings

0.9741

Mutual Funds

Held by 24 Schemes (14.08%)

FIIs

Held by 140 FIIs (7.44%)

Promoter with highest holding

Aagam Holdings Private Limited (22.6%)

Highest Public shareholder

Life Insurance Corporation Of India (5.44%)

Individual Investors Holdings

16.59%

stock-summaryFinancial
[
  {
    "link": "quarterly",
    "btn_text": "All Quarterly Results",
    "header": "Quarterly Results Snapshot (Consolidated) - Jun'26 - QoQ",
    "rhs": [
      {
        "prefix": "Net Sales ",
        "suffix": "QoQ Growth in quarter ended Jun 2026 is 10.65% vs 6.13% in Mar 2026",
        "dir": 1
      },
      {
        "prefix": "Consolidated Net Profit ",
        "suffix": "QoQ Growth in quarter ended Jun 2026 is 16.73% vs 30.74% in Mar 2026",
        "dir": -1
      }
    ],
    "table": {
      "header": [
        "Jun'26",
        "Mar'26",
        "Change(%)"
      ],
      "body": [
        {
          "field": "Net Sales",
          "val1": "1,847.95",
          "val2": "1,670.07",
          "chgp": "10.65%",
          "chgp_class": "positive"
        },
        {
          "field": "Operating Profit (PBDIT) excl Other Income",
          "val1": "393.54",
          "val2": "280.72",
          "chgp": "40.19%",
          "chgp_class": "positive"
        },
        {
          "field": "Interest",
          "val1": "4.02",
          "val2": "4.30",
          "chgp": "-6.51%",
          "chgp_class": "positive"
        },
        {
          "field": "Exceptional Items",
          "val1": "0.00",
          "val2": "0.00",
          "chgp": "",
          "chgp_class": "neutral"
        },
        {
          "field": "Consolidate Net Profit",
          "val1": "245.30",
          "val2": "210.15",
          "chgp": "16.73%",
          "chgp_class": "positive"
        },
        {
          "field": "Operating Profit Margin (Excl OI)",
          "val1": "21.30%",
          "val2": "16.81%",
          "chgp": "4.49%",
          "chgp_class": "positive"
        }
      ]
    }
  },
  {
    "link": "half-yearly",
    "btn_text": "All Half Yearly Results",
    "header": "Half Yearly Results Snapshot (Consolidated) - Sep'25",
    "rhs": [
      {
        "prefix": "Net Sales ",
        "suffix": " Growth in half year ended Sep 2025 is 11.60% vs 14.28% in Sep 2024",
        "dir": -1
      },
      {
        "prefix": "Consolidated Net Profit ",
        "suffix": " Growth in half year ended Sep 2025 is 23.45% vs 28.41% in Sep 2024",
        "dir": -1
      }
    ],
    "table": {
      "header": [
        "Sep'25",
        "Sep'24",
        "Change(%)"
      ],
      "body": [
        {
          "field": "Net Sales",
          "val1": "3,029.85",
          "val2": "2,714.88",
          "chgp": "11.60%",
          "chgp_class": "positive"
        },
        {
          "field": "Operating Profit (PBDIT) excl Other Income",
          "val1": "502.99",
          "val2": "465.97",
          "chgp": "7.94%",
          "chgp_class": "positive"
        },
        {
          "field": "Interest",
          "val1": "9.43",
          "val2": "14.27",
          "chgp": "-33.92%",
          "chgp_class": "positive"
        },
        {
          "field": "Exceptional Items",
          "val1": "0.00",
          "val2": "0.00",
          "chgp": "",
          "chgp_class": "neutral"
        },
        {
          "field": "Consolidate Net Profit",
          "val1": "307.01",
          "val2": "248.69",
          "chgp": "23.45%",
          "chgp_class": "positive"
        },
        {
          "field": "Operating Profit Margin (Excl OI)",
          "val1": "16.60%",
          "val2": "17.16%",
          "chgp": "-0.56%",
          "chgp_class": "negative"
        }
      ]
    }
  },
  {
    "link": "nine-monthly",
    "btn_text": "All Nine Monthly Results",
    "header": "Nine Monthly Results Snapshot (Consolidated) - Dec'25",
    "rhs": [
      {
        "prefix": "Net Sales ",
        "suffix": "YoY Growth in nine months ended Dec 2025 is 11.42% vs 17.59% in Dec 2024",
        "dir": -1
      },
      {
        "prefix": "Consolidated Net Profit ",
        "suffix": "YoY Growth in nine months ended Dec 2025 is 30.86% vs 35.08% in Dec 2024",
        "dir": -1
      }
    ],
    "table": {
      "header": [
        "Dec'25",
        "Dec'24",
        "Change(%)"
      ],
      "body": [
        {
          "field": "Net Sales",
          "val1": "4,603.47",
          "val2": "4,131.71",
          "chgp": "11.42%",
          "chgp_class": "positive"
        },
        {
          "field": "Operating Profit (PBDIT) excl Other Income",
          "val1": "750.05",
          "val2": "690.03",
          "chgp": "8.70%",
          "chgp_class": "positive"
        },
        {
          "field": "Interest",
          "val1": "13.13",
          "val2": "18.56",
          "chgp": "-29.26%",
          "chgp_class": "positive"
        },
        {
          "field": "Exceptional Items",
          "val1": "0.00",
          "val2": "0.00",
          "chgp": "",
          "chgp_class": "neutral"
        },
        {
          "field": "Consolidate Net Profit",
          "val1": "467.75",
          "val2": "357.43",
          "chgp": "30.86%",
          "chgp_class": "positive"
        },
        {
          "field": "Operating Profit Margin (Excl OI)",
          "val1": "16.29%",
          "val2": "16.70%",
          "chgp": "-0.41%",
          "chgp_class": "negative"
        }
      ]
    }
  },
  {
    "link": "annual",
    "btn_text": "All Annual Results",
    "header": "Annual Results Snapshot (Consolidated) - Mar'26",
    "rhs": [
      {
        "prefix": "Net Sales ",
        "suffix": "YoY Growth in year ended Mar 2026 is 12.36% vs 18.15% in Mar 2025",
        "dir": -1
      },
      {
        "prefix": "Consolidated Net Profit ",
        "suffix": "YoY Growth in year ended Mar 2026 is 40.08% vs 49.81% in Mar 2025",
        "dir": -1
      }
    ],
    "table": {
      "header": [
        "Mar'26",
        "Mar'25",
        "Change(%)"
      ],
      "body": [
        {
          "field": "Net Sales",
          "val1": "6,273.54",
          "val2": "5,583.35",
          "chgp": "12.36%",
          "chgp_class": "positive"
        },
        {
          "field": "Operating Profit (PBDIT) excl Other Income",
          "val1": "1,030.79",
          "val2": "912.96",
          "chgp": "12.91%",
          "chgp_class": "positive"
        },
        {
          "field": "Interest",
          "val1": "17.43",
          "val2": "23.98",
          "chgp": "-27.31%",
          "chgp_class": "positive"
        },
        {
          "field": "Exceptional Items",
          "val1": "0.00",
          "val2": "0.00",
          "chgp": "",
          "chgp_class": "neutral"
        },
        {
          "field": "Consolidate Net Profit",
          "val1": "677.90",
          "val2": "483.93",
          "chgp": "40.08%",
          "chgp_class": "positive"
        },
        {
          "field": "Operating Profit Margin (Excl OI)",
          "val1": "16.43%",
          "val2": "16.35%",
          "chgp": "0.08%",
          "chgp_class": "positive"
        }
      ]
    }
  }
]

Quarterly Results Snapshot (Consolidated) - Jun'26 - QoQstock-summary

Jun'26
Mar'26
Change(%)
Net Sales
1,847.95
1,670.07
10.65%
Operating Profit (PBDIT) excl Other Income
393.54
280.72
40.19%
Interest
4.02
4.30
-6.51%
Exceptional Items
0.00
0.00
Consolidate Net Profit
245.30
210.15
16.73%
Operating Profit Margin (Excl OI)
21.30%
16.81%
4.49%
Values in Rs Cr.
Direction Arrows
Net Sales

QoQ Growth in quarter ended Jun 2026 is 10.65% vs 6.13% in Mar 2026

Direction Arrows
Consolidated Net Profit

QoQ Growth in quarter ended Jun 2026 is 16.73% vs 30.74% in Mar 2026

Half Yearly Results Snapshot (Consolidated) - Sep'25stock-summary

Sep'25
Sep'24
Change(%)
Net Sales
3,029.85
2,714.88
11.60%
Operating Profit (PBDIT) excl Other Income
502.99
465.97
7.94%
Interest
9.43
14.27
-33.92%
Exceptional Items
0.00
0.00
Consolidate Net Profit
307.01
248.69
23.45%
Operating Profit Margin (Excl OI)
16.60%
17.16%
-0.56%
Values in Rs Cr.
Direction Arrows
Net Sales

Growth in half year ended Sep 2025 is 11.60% vs 14.28% in Sep 2024

Direction Arrows
Consolidated Net Profit

Growth in half year ended Sep 2025 is 23.45% vs 28.41% in Sep 2024

Nine Monthly Results Snapshot (Consolidated) - Dec'25stock-summary

Dec'25
Dec'24
Change(%)
Net Sales
4,603.47
4,131.71
11.42%
Operating Profit (PBDIT) excl Other Income
750.05
690.03
8.70%
Interest
13.13
18.56
-29.26%
Exceptional Items
0.00
0.00
Consolidate Net Profit
467.75
357.43
30.86%
Operating Profit Margin (Excl OI)
16.29%
16.70%
-0.41%
Values in Rs Cr.
Direction Arrows
Net Sales

YoY Growth in nine months ended Dec 2025 is 11.42% vs 17.59% in Dec 2024

Direction Arrows
Consolidated Net Profit

YoY Growth in nine months ended Dec 2025 is 30.86% vs 35.08% in Dec 2024

Annual Results Snapshot (Consolidated) - Mar'26stock-summary

Mar'26
Mar'25
Change(%)
Net Sales
6,273.54
5,583.35
12.36%
Operating Profit (PBDIT) excl Other Income
1,030.79
912.96
12.91%
Interest
17.43
23.98
-27.31%
Exceptional Items
0.00
0.00
Consolidate Net Profit
677.90
483.93
40.08%
Operating Profit Margin (Excl OI)
16.43%
16.35%
0.08%
Values in Rs Cr.
Direction Arrows
Net Sales

YoY Growth in year ended Mar 2026 is 12.36% vs 18.15% in Mar 2025

Direction Arrows
Consolidated Net Profit

YoY Growth in year ended Mar 2026 is 40.08% vs 49.81% in Mar 2025

stock-summaryCompany CV
About Atul Ltd. stock-summary
stock-summary
Atul Ltd.
Small Cap
Specialty Chemicals
Atul Limited, a diversified Indian company, a part of Lalbhai Group, is mainly engaged in the business of Life Science Chemicals and Performance and Other Chemicals meeting the needs of varied industries such as Adhesives, Agriculture, Animal Feed, Automobile, Composites, Construction, Cosmetic, Defence, Dyestuff, Electrical and Electronics, Foam and Furnishing, Flavour, Food, Footwear, Fragrance, Glass, Handicraft, Home Care, Horticulture, Hospitality, Paint and Coatings, Paper, Personal Care,
Company Coordinates stock-summary
Company Details
Atul House, G I Patel Marg Ahmedabad Gujarat : 380014
stock-summary
Tel: 91-79-26460520/26461294/26463706
stock-summary
sec@atul.co.in
Registrar Details