
Compare Aarti Industries with Similar Stocks
Stock DNA
Specialty Chemicals
INR 18,198 Cr (Small Cap)
44.00
46
0.20%
0.73
6.92%
3.05
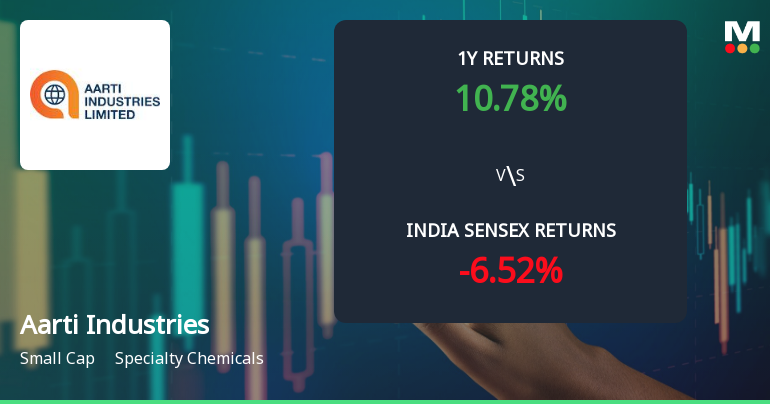
Total Returns (Price + Dividend) 
Latest dividend: 1 per share ex-dividend date: Aug-18-2025
Risk Adjusted Returns v/s
Returns Beta

News
Aarti Industries Ltd. Technical Momentum Shifts Signal Bullish Outlook
Aarti Industries Ltd., a specialty chemicals company, has exhibited a notable shift in technical momentum, moving from a mildly bullish to a bullish stance. This change is underscored by a series of positive signals across key technical indicators including MACD, moving averages, and Bollinger Bands, suggesting a strengthening price trend amid a robust market backdrop.
Read full news article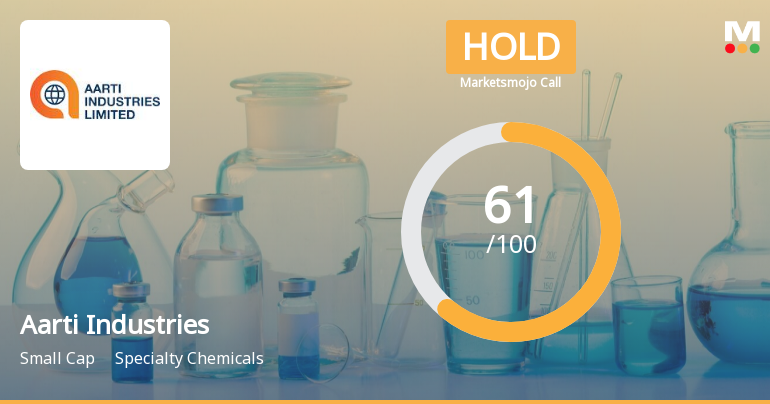
Aarti Industries Ltd. is Rated Hold by MarketsMOJO
Aarti Industries Ltd. is rated 'Hold' by MarketsMOJO, with this rating last updated on 09 March 2026. However, the analysis and financial metrics discussed here reflect the company’s current position as of 11 July 2026, providing investors with an up-to-date view of its fundamentals, returns, and market standing.
Read full news article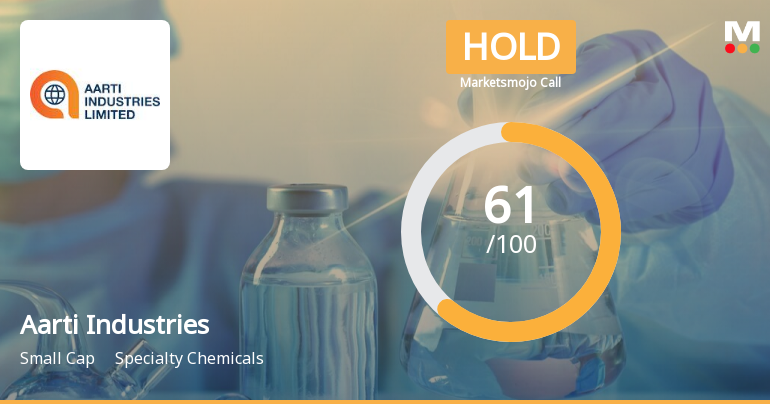
Aarti Industries Ltd. is Rated Hold by MarketsMOJO
Aarti Industries Ltd. is rated 'Hold' by MarketsMOJO, with this rating last updated on 09 Mar 2026. However, the analysis and financial metrics discussed here reflect the company’s current position as of 30 June 2026, providing investors with an up-to-date perspective on the stock’s fundamentals, valuation, financial trends, and technical outlook.
Read full news article Announcements
Aarti Industries Limited - Updates
28-Nov-2019 | Source : NSEAarti Industries Limited has informed the Exchange regarding 'Intimation under Regulation 39(3) of SEBI (Listing Obligations and Disclosure Requirements) Regulations, 2015 '.
Aarti Industries Limited - Updates
26-Nov-2019 | Source : NSEAarti Industries Limited has informed the Exchange regarding 'Intimation for incorporation of Wholly Owned Subsidiary (WOS) Companies'.namely - Aarti Organics Limited & Aarti Bharuch Limited
Aarti Industries Limited - Analysts/Institutional Investor Meet/Con. Call Updates
22-Nov-2019 | Source : NSEAarti Industries Limited has informed the Exchange regarding Analysts/Institutional Investor Meet/Con. Call Updates
Corporate Actions

No Upcoming Board Meetings

Aarti Industries Ltd. has declared 20% dividend, ex-date: 18 Aug 25

No Splits history available

Aarti Industries Ltd. has announced 1:1 bonus issue, ex-date: 22 Jun 21

No Rights history available
Quality key factors
Valuation key factors
Technicals key factors
 Technical Indicator Scale: Bearish, Mildly Bearish, Sideways, Mildly Bullish, Bullish Turned
 Shareholding Snapshot : Mar 2026
Shareholding Compare (%holding)
Promoters
3.5692
Held by 24 Schemes (11.51%)
Held by 159 FIIs (7.38%)
Rashesh Chandrakant Gogri (4.09%)
Life Insurance Corporation Of India (6.8%)
25.8%
Quarterly Results Snapshot (Consolidated) - Mar'26 - QoQ

QoQ Growth in quarter ended Mar 2026 is -4.87% vs 10.38% in Dec 2025
QoQ Growth in quarter ended Mar 2026 is 3.01% vs 25.47% in Dec 2025
Half Yearly Results Snapshot (Consolidated) - Sep'25
Growth in half year ended Sep 2025 is 8.51% vs 21.34% in Sep 2024
Growth in half year ended Sep 2025 is -21.16% vs 18.12% in Sep 2024
Nine Monthly Results Snapshot (Consolidated) - Dec'25
YoY Growth in nine months ended Dec 2025 is 14.48% vs 15.72% in Dec 2024

YoY Growth in nine months ended Dec 2025 is 20.00% vs -17.25% in Dec 2024
Annual Results Snapshot (Consolidated) - Mar'26
YoY Growth in year ended Mar 2026 is 13.99% vs 14.10% in Mar 2025
YoY Growth in year ended Mar 2026 is 26.97% vs -20.67% in Mar 2025
About Aarti Industries Ltd.

Company Coordinates


