

Atul Ltd. Technical Momentum Shifts Amid Mixed Market Signals
2026-07-15 08:00:35Atul Ltd., a specialty chemicals company, has experienced a notable shift in its technical momentum, moving from a mildly bullish stance to a sideways trend. This change is underscored by a complex interplay of technical indicators, including MACD, RSI, moving averages, and Bollinger Bands, reflecting a nuanced market sentiment amid recent price volatility.
Read full news article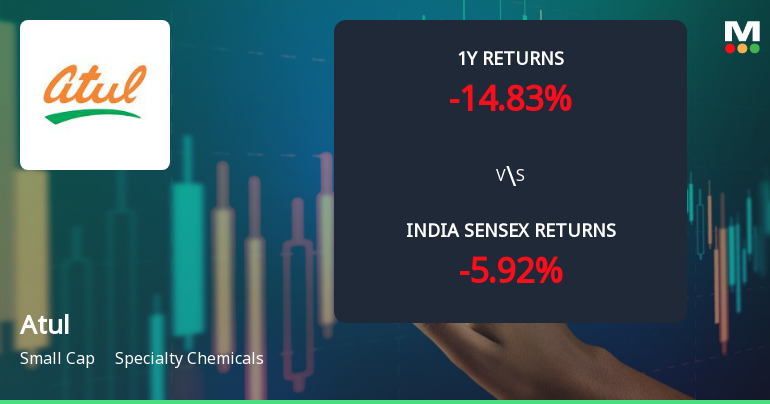
Atul Ltd. Technical Momentum Shifts Signal Mild Bullish Outlook Amid Mixed Indicators
2026-07-14 08:01:00Atul Ltd., a specialty chemicals company, has recently exhibited a subtle shift in its technical momentum, moving from a sideways trend to a mildly bullish stance. This change is underscored by a complex interplay of technical indicators, including MACD, RSI, moving averages, and Bollinger Bands, which collectively suggest cautious optimism for investors amid mixed signals across weekly and monthly timeframes.
Read full news article
Atul Ltd. Technical Momentum Shifts Amid Mixed Indicator Signals
2026-07-09 08:00:59Atul Ltd., a small-cap player in the specialty chemicals sector, has experienced a notable shift in its technical momentum, moving from a mildly bullish stance to a sideways trend. This transition is underscored by a complex interplay of technical indicators, including MACD, RSI, Bollinger Bands, and moving averages, which collectively paint a nuanced picture of the stock’s near-term prospects.
Read full news article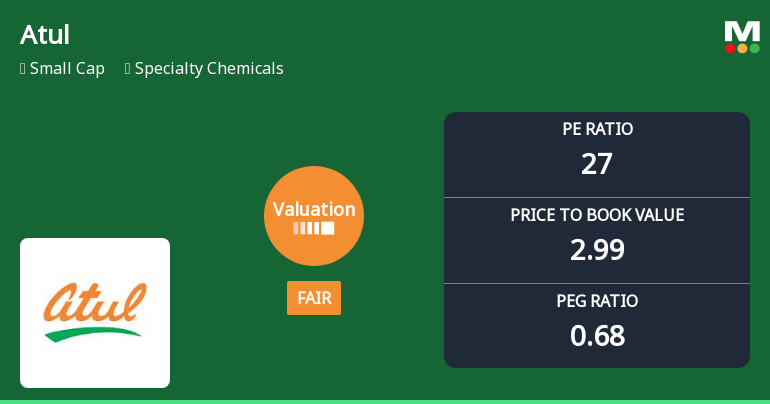
Atul Ltd. Valuation Shifts to Fair; P/E and P/BV Metrics Signal Improved Price Attractiveness
2026-07-09 08:00:10Atul Ltd., a key player in the specialty chemicals sector, has seen a notable shift in its valuation parameters, moving from an expensive to a fair valuation grade. This change is underpinned by a recalibration of its price-to-earnings (P/E) and price-to-book value (P/BV) ratios, positioning the stock as more attractive relative to its historical levels and peer group. Despite a recent dip in share price, the company’s fundamental metrics and comparative valuation suggest a more balanced risk-reward profile for investors.
Read full news article
Atul Ltd. is Rated Hold
2026-07-06 10:10:05Atul Ltd. is rated 'Hold' by MarketsMOJO, with this rating last updated on 08 April 2026. However, the analysis and financial metrics discussed here reflect the company’s current position as of 06 July 2026, providing investors with an up-to-date view of its fundamentals, returns, and market standing.
Read full news article
Atul Ltd. is Rated Hold by MarketsMOJO
2026-06-25 10:10:05Atul Ltd. is rated 'Hold' by MarketsMOJO, with this rating last updated on 08 April 2026. While the rating change occurred on that date, the analysis and financial metrics presented here reflect the company’s current position as of 25 June 2026, providing investors with an up-to-date view of the stock’s fundamentals, valuation, financial trends, and technical outlook.
Read full news article
Atul Ltd. is Rated Hold by MarketsMOJO
2026-06-14 10:10:04Atul Ltd. is rated 'Hold' by MarketsMOJO, with this rating last updated on 08 April 2026. While the rating change occurred on that date, the analysis and financial metrics discussed here reflect the company’s current position as of 14 June 2026, providing investors with an up-to-date view of the stock’s fundamentals, valuation, financial trends, and technical outlook.
Read full news article
Atul Ltd. Technical Momentum Shifts to Mildly Bullish Amid Mixed Signals
2026-06-08 08:00:25Atul Ltd., a specialty chemicals company, has experienced a nuanced shift in its technical momentum, moving from a bullish to a mildly bullish stance. Despite a modest decline in its share price, key technical indicators such as MACD, RSI, and moving averages suggest a complex interplay of bullish and bearish signals, reflecting cautious investor sentiment amid broader market volatility.
Read full news article
Atul Ltd. is Rated Hold by MarketsMOJO
2026-06-03 10:10:03Atul Ltd. is rated 'Hold' by MarketsMOJO, with this rating last updated on 08 April 2026. However, the analysis and financial metrics discussed here reflect the stock's current position as of 03 June 2026, providing investors with an up-to-date view of its performance and prospects.
Read full news articleAtul Limited - Updates
18-Nov-2019 | Source : NSEAtul Limited has informed the Exchange regarding 'Newspaper advertisement pursuant to the SEBI Circular No. SEBI/HO/MIRSD/DOS3/CIR/P/2018/139 dated November 06, 2018 '.
Atul Limited - Dividend
25-Oct-2019 | Source : NSEAtul Limited has informed the Exchange that Board of Directors of the Company at the Meeting held on October 25, 2016 has also approved and declared special interim dividend of Rs 12.50/- (Twelve rupees and fifty paisa) per equity share to commemorate the 125th birth anniversary of the illustrious Founder of the Company, Shri Kasturbhai Lalbhai.
Atul Limited - Record Date
22-Oct-2019 | Source : NSEAtul Limited has informed the Exchange that the Company has fixed Record Date as November 5, 2019 for the purpose of Special interim dividend.
Corporate Actions

24 Jul 2026

Atul Ltd. has declared 300% dividend, ex-date: 17 Jul 26

No Splits history available

No Bonus history available

No Rights history available


