
Compare Ucal with Similar Stocks
Dashboard
Weak Long Term Fundamental Strength with a -190.53% CAGR growth in Operating Profits over the last 5 years
- Low ability to service debt as the company has a high Debt to EBITDA ratio of 4.58 times
- The company has been able to generate a Return on Equity (avg) of 4.30% signifying low profitability per unit of shareholders funds
Flat results in Dec 25
Risky - Negative Operating Profits
Consistent Underperformance against the benchmark over the last 3 years
Stock DNA
Auto Components & Equipments
INR 225 Cr (Micro Cap)
NA (Loss Making)
34
0.00%
0.74
-7.15%
0.65
Total Returns (Price + Dividend) 
Latest dividend: 2 per share ex-dividend date: Sep-22-2023
Risk Adjusted Returns v/s
Returns Beta

News
Ucal Ltd is Rated Strong Sell
Ucal Ltd is rated Strong Sell by MarketsMOJO, with this rating last updated on 30 May 2025. However, the analysis and financial metrics discussed here reflect the company’s current position as of 12 March 2026, providing investors with the latest insights into its performance and outlook.
Read full news article
Ucal Ltd Stock Falls to 52-Week Low of Rs.99.1 Amidst Continued Downtrend
Ucal Ltd, a company operating in the Auto Components & Equipments sector, has touched a new 52-week low of Rs.99.1 today, marking a significant decline in its stock price amid broader market pressures and sectoral weakness.
Read full news article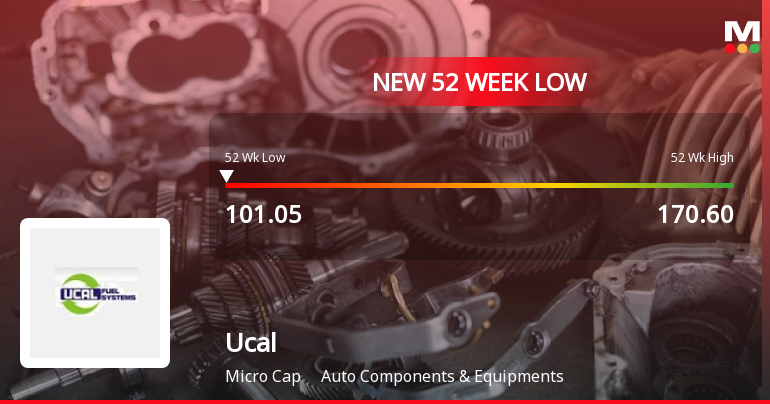
Ucal Ltd Stock Falls to 52-Week Low of Rs.101.05 Amidst Continued Underperformance
Ucal Ltd, a player in the Auto Components & Equipments sector, touched a fresh 52-week low of Rs.101.05 today, marking a significant decline in its stock price amid ongoing challenges reflected in its financial and market performance.
Read full news article Announcements
Ucal Fuel Systems Limited - Outcome of Board Meeting
04-Nov-2019 | Source : NSEUcal Fuel Systems Limited has informed the Exchange regarding Board meeting held on November 02, 2019.
Book Closure
03-Sep-2019 | Source : NSE
| Ucal Fuel Systems Limited has informed the Exchange that the Register of Members & Share Transfer Books of the Company will remain closed from September 21, 2019 to September 30, 2019 (both days inclusive) for the purpose of declaration of dividend. |
Shareholders meeting
31-Aug-2019 | Source : NSE
| Ucal Fuel Systems Limited has informed the Exchange regarding Notice of Annual General Meeting to be held on September 30, 2019 |
Corporate Actions

No Upcoming Board Meetings

Ucal Ltd has declared 20% dividend, ex-date: 22 Sep 23

No Splits history available

No Bonus history available

No Rights history available
Quality key factors
Valuation key factors
Technicals key factors
 Technical Indicator Scale: Bearish, Mildly Bearish, Sideways, Mildly Bullish, Bullish Turned
 Shareholding Snapshot : Dec 2025
Shareholding Compare (%holding)
Promoters
None
Held by 5 Schemes (0.01%)
Held by 0 FIIs
Carburettors Limited (51.19%)
Amol Maniklal Kankariya (1.06%)
25.21%
Quarterly Results Snapshot (Consolidated) - Dec'25 - QoQ

QoQ Growth in quarter ended Dec 2025 is -6.05% vs 8.63% in Sep 2025
QoQ Growth in quarter ended Dec 2025 is -116.78% vs 25.62% in Sep 2025
Half Yearly Results Snapshot (Consolidated) - Sep'25
Growth in half year ended Sep 2025 is 1.43% vs 11.51% in Sep 2024
Growth in half year ended Sep 2025 is -416.26% vs 67.93% in Sep 2024
Nine Monthly Results Snapshot (Consolidated) - Dec'25
YoY Growth in nine months ended Dec 2025 is 0.16% vs 10.49% in Dec 2024
YoY Growth in nine months ended Dec 2025 is -570.16% vs 159.58% in Dec 2024
Annual Results Snapshot (Consolidated) - Mar'25

YoY Growth in year ended Mar 2025 is 10.94% vs -12.13% in Mar 2024
YoY Growth in year ended Mar 2025 is 35.55% vs -3,071.76% in Mar 2024
About Ucal Ltd

Company Coordinates


