Saksoft

  • Market Cap: Small Cap
  • Industry: Computers - Software & Consulting
  • ISIN: INE667G01023
  • NSEID: SAKSOFT
  • BSEID: 590051
INR
151.62
1.24 (0.82%)
BSENSE

Sep 03, 09:38 AM

BSE+NSE Vol: 49.28 k

  • Price Points
  • Score
  • Mojo Parameters
  • Total Return
  • News and Corporate Actions
  • Key factors
  • Shareholding
  • Financials
  • CompanyCV
stock-summaryPrice Point
High/Low

1Day

52 Week

Valuation
Technical
Day's Volume

CASH

49.28 k (53.71%) Volume

Shareholding (Jun 2026)

FII

2.17%

Held by 42 FIIs

DII

0.01%

Held by 0 DIIs

Promoter

66.72%

Why is Saksoft Ltd falling/rising?

03-Sep-2026

As of 02-Sep, Saksoft Ltd's stock price is at 150.55, reflecting a decline of 2.37%. The stock has been on a downward trend, underperforming its sector and showing significant losses over various periods, while investor interest has waned and financial performance has been unfavorable.

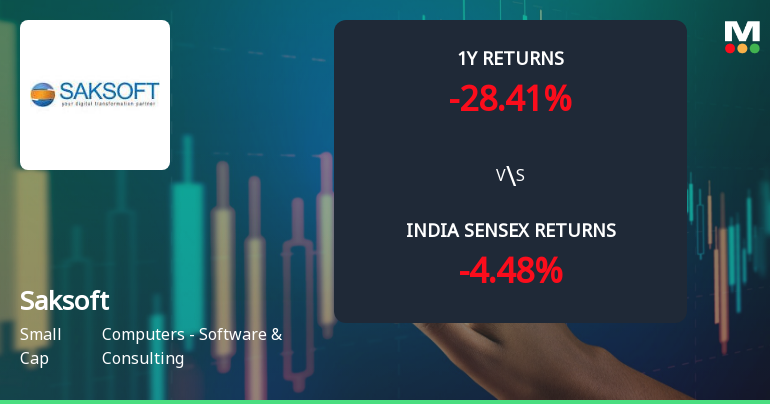
As of 02-Sep, Saksoft Ltd's stock price is falling, currently at 150.55, reflecting a decrease of 3.65 (-2.37%). The stock has been on a downward trend, having lost 5.92% over the last three days and underperforming its sector by 0.87% today. Additionally, it has experienced significant declines over various periods, including a 6.52% drop over the past week and an 11.02% decline over the past month.<BR><BR>The stock is trading below its moving averages across multiple timeframes, indicating a bearish trend. Investor participation has also decreased, with delivery volume falling by 12.93% compared to the five-day average. This lack of interest may contribute to the stock's decline.<BR><BR>Financial performance has not been favorable either, as the company reported flat results for the quarter ending June 26, with net sales at their lowest of Rs 248.62 crore and a 9.5% drop in profit after tax to Rs 29.29 crore. Furthermore, the stock has consistently underperformed against benchmarks, generating a return of -28.41% over the past year, while domestic mutual funds hold no stake in the company, suggesting a lack of confidence in its valuation or business prospects.<BR><BR>Despite being net-debt free and having a reasonable return on equity of 17.6, the overall sentiment surrounding Saksoft Ltd remains negative, contributing to the ongoing decline in its stock price.

View full answer

Should I buy, sell or hold Saksoft Ltd?

02-Sep-2026

Who are in the management team of Saksoft?

01-Sep-2026

The management team of Saksoft includes Aditya Krishna (Chairman & Managing Director), Ajit Thomas, Kanika Krishna, VVR Babu, Ganesh Chella, Malini Thadani (all Non-Executive & Independent Directors), Meera Venkatramanan (Company Secretary), and Kavitha Vijay (Independent Director), bringing diverse expertise to the company.

The management team of Saksoft includes the following individuals:<BR><BR>1. **Aditya Krishna** - Chairman & Managing Director<BR>2. **Ajit Thomas** - Non-Executive & Independent Director<BR>3. **Kanika Krishna** - Non-Executive & Non-Independent Director<BR>4. **VVR Babu** - Non-Executive & Independent Director<BR>5. **Ganesh Chella** - Non-Executive & Independent Director<BR>6. **Meera Venkatramanan** - Company Secretary & Compliance Officer<BR>7. **Malini Thadani** - Non-Executive & Independent Director<BR>8. **Kavitha Vijay** - Independent Director<BR><BR>This diverse team brings a range of expertise and governance to the company.

View full answer

What does Saksoft do?

01-Sep-2026

Saksoft Ltd is a small-cap company specializing in Information Management Solutions within the software and consulting industry, reporting net sales of 249 Cr and a net profit of 29 Cr for June 2026. The company has a market cap of INR 2,081 Cr and key metrics include a P/E ratio of 15.00 and a dividend yield of 0.63%.

Overview:<BR>Saksoft Ltd is a leading provider of Information Management Solutions in the Computers - Software & Consulting industry, categorized as a small-cap company.<BR><BR>History:<BR>Saksoft Ltd was incorporated on November 24, 1999, originally named Sak Infotech Ltd, and changed its name in September 2002. The most recent quarterly results reported net sales and profit for June 2026.<BR><BR>Financial Snapshot:<BR>- Net Sales: 249 Cr (Quarterly Results - Jun 2026)<BR>- Net Profit: 29 Cr (Quarterly Results - Jun 2026)<BR>- Market Cap: INR 2,081 Cr (Small Cap)<BR><BR>Key Metrics:<BR>- P/E: 15.00<BR>- Industry P/E: 22<BR>- Dividend Yield: 0.63%<BR>- Debt Equity: -0.27<BR>- Return on Equity: 17.59%<BR>- Price to Book: 2.72<BR><BR>Contact Details:<BR>Address: SP Infocity Module 1 2nd Flr, No 40 MGR Salai Perungudi Chennai Tamil Nadu : 600096<BR>Tel: 91-44-24543500<BR>Email: info@saksoft.com<BR>Website: http://www.saksoft.com

View full answer

Who are the peers of the Saksoft?

01-Sep-2026

Saksoft's peers include R Systems Intl., Sasken Technol., Zaggle Prepaid, GHV Infra, Silver Touch, Protean eGov, Hypersoft Tech., Accelya Solution, Aurum Proptech, and Kody Technolab. In terms of performance, Silver Touch has the highest 1-year return at 151.50%, while Saksoft's return is -26.65%.

Peers: The peers of Saksoft are R Systems Intl., Sasken Technol., Zaggle Prepaid, GHV Infra, Silver Touch, Protean eGov, Hypersoft Tech., Accelya Solution, Aurum Proptech, and Kody Technolab.<BR><BR>Quality Snapshot: Excellent management risk is observed at R Systems Intl. and the rest. Average management risk is found at Sasken Technol., GHV Infra, Silver Touch, Protean eGov, Saksoft, and Accelya Solution, while Below Average management risk is noted at Zaggle Prepaid, Hypersoft Tech., and Aurum Proptech. Growth ratings show Excellent growth at Zaggle Prepaid, GHV Infra, Silver Touch, and Kody Technolab, while Average growth is found at Saksoft and Aurum Proptech, and Below Average growth is seen at Sasken Technol. and Protean eGov. Excellent capital structure is present at R Systems Intl., Sasken Technol., Zaggle Prepaid, Silver Touch, Protean eGov, Saksoft, Hypersoft Tech., Accelya Solution, and the rest.<BR><BR>Return Snapshot: The peer with the highest 1-year return is Silver Touch at 151.50%, while Zaggle Prepaid has the lowest at -52.95%. Saksoft's 1-year return of -26.65% is better than Zaggle Prepaid's but worse than Silver Touch's. Additionally, peers with a negative six-month return include R Systems Intl., Zaggle Prepaid, GHV Infra, Protean eGov, and Accelya Solution.

View full answer

How big is Saksoft?

01-Sep-2026

As of 31st August, Saksoft Ltd has a market capitalization of 2,081.00 Cr, with recent Net Sales of 1,006.74 Cr and a Net Profit of 130.21 Cr. Shareholder's Funds are 778.96 Cr and Total Assets amount to 1,059.36 Cr as of March 2026.

As of 31st August, Saksoft Ltd has a market capitalization of 2,081.00 Cr, categorizing it as a Small Cap company.<BR><BR>In the latest four quarters, Saksoft reported Net Sales of 1,006.74 Cr and a Net Profit of 130.21 Cr.<BR><BR>The latest annual period for the balance sheet is March 2026, with Shareholder's Funds amounting to 778.96 Cr and Total Assets of 1,059.36 Cr.

View full answer

When is the next results date for Saksoft Ltd?

03-Aug-2026

The next results date for Saksoft Ltd is 07 August 2026.

The next results date for Saksoft Ltd is scheduled for 07 August 2026.

View full answer

Are Saksoft Ltd latest results good or bad?

26-May-2026

Saksoft Ltd's latest results show strong profit growth with a net profit increase of 23.81% quarter-on-quarter, but revenue declined by 0.77% for the second consecutive quarter, raising concerns about demand. Overall, while profit growth is positive, the lack of revenue support suggests caution for investors.

Saksoft Ltd's latest results present a mixed picture. On one hand, the company reported a net profit of ₹35.93 crores for Q4 FY26, which is a significant increase of 23.81% quarter-on-quarter and 19.65% year-on-year. This profit growth is encouraging and reflects improved operational efficiency, as indicated by an increase in the profit after tax (PAT) margin to 14.44%, up 287 basis points from the previous quarter.<BR><BR>However, the revenue figures tell a different story. The company experienced a revenue decline of 0.77% quarter-on-quarter, totaling ₹248.85 crores, marking the second consecutive quarter of revenue contraction. Year-on-year, revenue growth has also slowed significantly to 3.74%, down from much higher rates in previous quarters. This deceleration raises concerns about demand softness in their core markets.<BR><BR>While the operating margin improved to 18.19%, this was achieved despite rising employee costs, suggesting some operational efficiencies. Nonetheless, the overall financial performance indicates that while profits are growing, they are not being supported by corresponding revenue growth, which could raise questions about the sustainability of this profit momentum.<BR><BR>In summary, while the profit growth is a positive sign, the declining revenue trends and concerns about demand suggest that the overall results are not entirely favorable. Investors may need to be cautious and monitor future performance closely.

View full answer

Is Saksoft technically bullish or bearish?

05-Dec-2025

As of December 4, 2025, the stock trend has shifted to mildly bearish, trading at 197.45 below the previous close of 200.90, underperforming the Sensex with a year-to-date decline of 9.01%.

As of 4 December 2025, the technical trend has changed from mildly bullish to mildly bearish. The current price of 197.45 is below the previous close of 200.90, indicating a downward movement. The stock has underperformed the Sensex over multiple time frames, including a year-to-date decline of 9.01% compared to the Sensex's gain of 9.12%. The recent high of 204.95 today has not sustained, and the stock is trading closer to its 52-week low of 119.55. Overall, the indicators suggest a mildly bearish stance with weakening momentum.

View full answer

How has been the historical performance of Saksoft?

02-Dec-2025

Saksoft has demonstrated consistent growth in net sales and profits, with net sales increasing from INR 358.05 crore in March 2019 to INR 883.01 crore in March 2025, and profit after tax rising from INR 38.21 crore to INR 108.80 crore during the same period. The company's total assets and operating cash flow also showed significant improvement, reflecting a robust expansion strategy.

Answer:<BR>The historical performance of Saksoft shows a consistent growth trajectory in net sales and profits over the years.<BR><BR>Breakdown:<BR>Saksoft's net sales have increased significantly from INR 358.05 crore in March 2019 to INR 883.01 crore in March 2025, demonstrating a strong upward trend. Total operating income followed a similar pattern, rising from INR 358.05 crore in March 2019 to INR 883.01 crore in March 2025. The company's operating profit (PBDIT) also saw a steady increase, reaching INR 163.08 crore in March 2025, up from INR 61.35 crore in March 2019. Profit before tax rose from INR 52.27 crore in March 2019 to INR 141.96 crore in March 2025, while profit after tax increased from INR 38.21 crore to INR 108.80 crore in the same period. The total assets of Saksoft grew from INR 300.48 crore in March 2019 to INR 978.75 crore in March 2025, reflecting a robust expansion strategy. Total liabilities also increased, from INR 300.48 crore in March 2019 to INR 978.75 crore in March 2025, indicating a rise in borrowing, particularly in long-term borrowings which surged from INR 0.00 crore in March 2023 to INR 32.61 crore in March 2025. Cash flow from operating activities improved from INR 56.00 crore in March 2020 to INR 111.00 crore in March 2025, while net cash inflow fluctuated, reaching INR 26.00 crore in March 2025. Overall, Saksoft's financial metrics reflect a positive growth trend and operational efficiency over the years.

View full answer

Has Saksoft declared dividend?

12-Nov-2025

Saksoft Ltd has declared a 45% dividend, with an ex-date of November 14, 2025. Despite some fluctuations in returns, the company has shown substantial long-term growth, particularly a total return of 698.88% over the last 5 years.

Saksoft Ltd has declared a 45% dividend.<BR><BR>Dividend Details:<BR>- Percentage announced: 45%<BR>- Ex-date: 14 Nov 25<BR><BR>Dividend Yield: 0.39%.<BR><BR>Total Returns by Period:<BR>In the last 3 months, the price return was -2.4%, the dividend return was 0.22%, resulting in a total return of -2.18%.<BR><BR>Over the past 6 months, the price return was 20.1%, the dividend return was 0.47%, leading to a total return of 20.57%.<BR><BR>For the 1-year period, the price return was -8.87%, the dividend return was 0.59%, culminating in a total return of -8.28%.<BR><BR>In the 2-year span, the price return was -29.08%, the dividend return was 0.59%, resulting in a total return of -28.49%.<BR><BR>Over the last 3 years, the price return was 119.01%, the dividend return was 2.69%, giving a total return of 121.7%.<BR><BR>In the 4-year period, the price return was 192.73%, the dividend return was 7.39%, leading to a total return of 200.12%.<BR><BR>Finally, in the 5-year timeframe, the price return was 655.89%, the dividend return was 42.99%, resulting in a total return of 698.88%.<BR><BR>Overall, Saksoft Ltd has declared a significant dividend, and despite some fluctuations in total returns over different periods, the long-term performance shows substantial growth, particularly in the 5-year span.

View full answer

Is Saksoft overvalued or undervalued?

03-Oct-2025

As of October 1, 2025, Saksoft is considered undervalued with a PE ratio of 22.72 and an attractive valuation grade, despite a recent stock decline, due to its strong long-term performance of 584.33% over five years compared to its peers.

As of 1 October 2025, Saksoft's valuation grade has moved from fair to attractive, indicating a positive shift in its market perception. The company is currently assessed as undervalued, given its PE ratio of 22.72, EV to EBITDA of 15.94, and a PEG ratio of 1.16, which suggest that it is trading at a reasonable price relative to its earnings growth potential. <BR><BR>In comparison to its peers, TCS has a PE ratio of 21.4 and an EV to EBITDA of 15.05, while Infosys stands at a PE of 22.03 and an EV to EBITDA of 14.44, highlighting that Saksoft is competitively priced within its industry. Despite recent stock performance trailing the Sensex, particularly over the past year with a decline of 26.70% compared to the Sensex's drop of only 3.90%, the long-term outlook remains strong with a remarkable 584.33% return over the past five years. This reinforces the notion that Saksoft is currently undervalued in the market.

View full answer

Who are the top shareholders of the Saksoft?

17-Jul-2025

The top shareholders of Saksoft include Sak Industries Private Limited with 45.72%, individual investors with 20.94%, and Sonnet Trade And Investments Private Limited holding 1.26%. Additionally, 52 Foreign Institutional Investors own 2.79%, while mutual funds hold 0.05%, with no pledged promoter holdings.

The top shareholders of Saksoft include a mix of promoters and public investors. The majority shareholder is Sak Industries Private Limited, which holds 45.72% of the shares. Individual investors collectively own 20.94% of the company. Additionally, Sonnet Trade And Investments Private Limited is the highest public shareholder with a stake of 1.26%. The company also has 52 Foreign Institutional Investors (FIIs) holding 2.79% of the shares, while mutual funds have a minimal presence with 0.05% held by one scheme. Notably, there are no pledged promoter holdings.

View full answer

What is the bonus history of the Saksoft?

06-Jun-2025

Saksoft recently announced a 1:4 bonus issue, with an ex-date and record date set for September 19, 2024. Shareholders will receive one additional share for every four shares held.

Saksoft has a recent bonus issue where they announced a 1:4 bonus. The ex-date for this bonus is set for September 19, 2024. This means that for every four shares held, shareholders will receive one additional share. The record date for this bonus is also September 19, 2024. If you have any more questions about Saksoft or its corporate actions, feel free to ask!

View full answer
iScoreScore
Click here to find our call on this stock
Strong Sell
Sell
Hold
Buy
Strong Buy

Dashboard

1

Flat results in Jun 26

  • NET SALES(Q) Lowest at Rs 248.62 cr
  • PAT(Q) At Rs 29.29 cr has Fallen at -9.5%
2

Despite the size of the company, domestic mutual funds hold only 0% of the company

stock-summaryMojo Parameters

Mojo Parameters

Loading Valuation Snapshot...

Stock DNA

stock-summary
Industry

Computers - Software & Consulting

stock-summary
Market cap

INR 2,010 Cr (Small Cap)

stock-summary
P/E

15.00

stock-summary
Industry P/E

21

stock-summary
Dividend Yield

0.66%

stock-summary
Debt Equity

-0.27

stock-summary
Return on Equity

17.59%

stock-summary
Price to Book

2.57

Revenue and Profits:
Net Sales:
249 Cr
(Quarterly Results - Jun 2026)
Net Profit:
29 Cr
stock-summaryTotal Returns
Total Returns (Price + Dividend) stock-summary
Dividend Yield (0.66%)
TimePeriod
Price Return
Dividend Return
Total Return
3 Months
4.3%
0.39%
4.69%
6 Months
11.5%
0.43%
11.93%
1 Year
-27.69%
0.49%
-27.2%
2 Years
-35.27%
0.62%
-34.65%
3 Years
-40.5%
0.93%
-39.57%
4 Years
87.19%
3.23%
90.42%
5 Years
119.61%
3.96%
123.57%

Latest dividend: 0.5522848664688428 per share ex-dividend date: Jul-31-2026

Risk Adjusted Returns v/s stock-summary
Returns Beta
Icon
Beta has not been calculated since enough price history is not available
stock-summaryNews & Corporate Actions

News

Announcements stock-summary

Saksoft Limited - Press Release

14-Nov-2019 | Source : NSE

Saksoft Limited has informed the Exchange regarding a press release dated November 13, 2019, titled "Press Release for Unaudited Stanalone and Consolidated Financial Results for 30092019".

Saksoft Limited - Record Date

13-Nov-2019 | Source : NSE

Saksoft Limited has informed the Exchange that the Company has fixed Record Date as November 25, 2019 for the purpose of Payment of Interim Dividend for FY 2019-20.

Saksoft Limited - Analysts/Institutional Investor Meet/Con. Call Updates

08-Nov-2019 | Source : NSE

Saksoft Limited has informed the Exchange regarding Analysts/Institutional Investor Meet/Con. Call Updates

Corporate Actions stock-summary

stock-summary
BOARD MEETING

No Upcoming Board Meetings

stock-summary
DIVIDEND

Saksoft Ltd has declared 55% dividend, ex-date: 31 Jul 26

stock-summary
SPLITS

Saksoft Ltd has announced 1:10 stock split, ex-date: 23 Sep 22

stock-summary
BONUS

Saksoft Ltd has announced 1:4 bonus issue, ex-date: 19 Sep 24

stock-summary
RIGHTS

No Rights history available

stock-summaryKey Factors

Quality key factors stock-summary

Factor
Value
Sales Growth (5y)
20.63%
EBIT Growth (5y)
24.16%
EBIT to Interest (avg)
29.51
Debt to EBITDA (avg)
0.25
Net Debt to Equity (avg)
-0.27
Sales to Capital Employed (avg)
1.40
Tax Ratio
27.33%
Dividend Payout Ratio
9.35%
Pledged Shares
0
Institutional Holding
2.18%
ROCE (avg)
32.28%
ROE (avg)
18.86%

Valuation key factors

Factor
Value
P/E Ratio
15
Industry P/E
21
Price to Book Value
2.57
EV to EBIT
10.37
EV to EBITDA
9.62
EV to Capital Employed
3.14
EV to Sales
1.78
PEG Ratio
0.94
Dividend Yield
0.66%
ROCE (Latest)
30.36%
ROE (Latest)
17.59%

Technicals key factors

Indicator
Weekly
Monthly
MACD
Mildly Bearish
Bearish
RSI
No Signal
No Signal
Bollinger Bands
Bearish
Bearish
Moving Averages
Mildly Bullish (Daily)
KST
Bullish
Bearish
Dow Theory
Mildly Bearish
Mildly Bearish
OBV
No Trend
No Trend
stock-summary Technical Indicator Scale: Bearish, Mildly Bearish, Sideways, Mildly Bullish, Bullish  Turned 
stock-summaryShareholding
Shareholding Snapshot : Jun 2026stock-summary
Shareholding Compare (%holding) stock-summary
Majority shareholders

Promoters

Pledged Promoter Holdings

None

Mutual Funds

Held by 0 Schemes

FIIs

Held by 42 FIIs (2.17%)

Promoter with highest holding

Sak Industries Private Limited (45.72%)

Highest Public shareholder

Sonnet Trade And Investments Private Limited (1.18%)

Individual Investors Holdings

22.21%

stock-summaryFinancial
[
  {
    "link": "quarterly",
    "btn_text": "All Quarterly Results",
    "header": "Quarterly Results Snapshot (Consolidated) - Jun'26 - YoY",
    "rhs": [
      {
        "prefix": "Net Sales ",
        "suffix": "YoY Growth in quarter ended Jun 2026 is -0.18% vs 23.91% in Jun 2025",
        "dir": -1
      },
      {
        "prefix": "Consolidated Net Profit ",
        "suffix": "YoY Growth in quarter ended Jun 2026 is -9.46% vs 26.42% in Jun 2025",
        "dir": -1
      }
    ],
    "table": {
      "header": [
        "Jun'26",
        "Jun'25",
        "Change(%)"
      ],
      "body": [
        {
          "field": "Net Sales",
          "val1": "248.62",
          "val2": "249.07",
          "chgp": "-0.18%",
          "chgp_class": "negative"
        },
        {
          "field": "Operating Profit (PBDIT) excl Other Income",
          "val1": "45.40",
          "val2": "45.82",
          "chgp": "-0.92%",
          "chgp_class": "negative"
        },
        {
          "field": "Interest",
          "val1": "1.26",
          "val2": "2.78",
          "chgp": "-54.68%",
          "chgp_class": "positive"
        },
        {
          "field": "Exceptional Items",
          "val1": "0.00",
          "val2": "0.00",
          "chgp": "",
          "chgp_class": "neutral"
        },
        {
          "field": "Consolidate Net Profit",
          "val1": "29.29",
          "val2": "32.35",
          "chgp": "-9.46%",
          "chgp_class": "negative"
        },
        {
          "field": "Operating Profit Margin (Excl OI)",
          "val1": "18.26%",
          "val2": "18.40%",
          "chgp": "-0.14%",
          "chgp_class": "negative"
        }
      ]
    }
  },
  {
    "link": "half-yearly",
    "btn_text": "All Half Yearly Results",
    "header": "Half Yearly Results Snapshot (Consolidated) - Sep'25",
    "rhs": [
      {
        "prefix": "Net Sales ",
        "suffix": " Growth in half year ended Sep 2025 is 21.92% vs 11.35% in Sep 2024",
        "dir": 1
      },
      {
        "prefix": "Consolidated Net Profit ",
        "suffix": " Growth in half year ended Sep 2025 is 32.00% vs 2.62% in Sep 2024",
        "dir": 1
      }
    ],
    "table": {
      "header": [
        "Sep'25",
        "Sep'24",
        "Change(%)"
      ],
      "body": [
        {
          "field": "Net Sales",
          "val1": "507.57",
          "val2": "416.30",
          "chgp": "21.92%",
          "chgp_class": "positive"
        },
        {
          "field": "Operating Profit (PBDIT) excl Other Income",
          "val1": "96.45",
          "val2": "71.81",
          "chgp": "34.31%",
          "chgp_class": "positive"
        },
        {
          "field": "Interest",
          "val1": "5.09",
          "val2": "3.44",
          "chgp": "47.97%",
          "chgp_class": "negative"
        },
        {
          "field": "Exceptional Items",
          "val1": "0.00",
          "val2": "0.00",
          "chgp": "",
          "chgp_class": "neutral"
        },
        {
          "field": "Consolidate Net Profit",
          "val1": "68.31",
          "val2": "51.75",
          "chgp": "32.00%",
          "chgp_class": "positive"
        },
        {
          "field": "Operating Profit Margin (Excl OI)",
          "val1": "19.00%",
          "val2": "17.25%",
          "chgp": "1.75%",
          "chgp_class": "positive"
        }
      ]
    }
  },
  {
    "link": "nine-monthly",
    "btn_text": "All Nine Monthly Results",
    "header": "Nine Monthly Results Snapshot (Consolidated) - Dec'25",
    "rhs": [
      {
        "prefix": "Net Sales ",
        "suffix": "YoY Growth in nine months ended Dec 2025 is 17.92% vs 13.48% in Dec 2024",
        "dir": 1
      },
      {
        "prefix": "Consolidated Net Profit ",
        "suffix": "YoY Growth in nine months ended Dec 2025 is 23.56% vs 7.95% in Dec 2024",
        "dir": 1
      }
    ],
    "table": {
      "header": [
        "Dec'25",
        "Dec'24",
        "Change(%)"
      ],
      "body": [
        {
          "field": "Net Sales",
          "val1": "758.35",
          "val2": "643.13",
          "chgp": "17.92%",
          "chgp_class": "positive"
        },
        {
          "field": "Operating Profit (PBDIT) excl Other Income",
          "val1": "141.83",
          "val2": "109.87",
          "chgp": "29.09%",
          "chgp_class": "positive"
        },
        {
          "field": "Interest",
          "val1": "7.04",
          "val2": "6.02",
          "chgp": "16.94%",
          "chgp_class": "negative"
        },
        {
          "field": "Exceptional Items",
          "val1": "-4.86",
          "val2": "0.00",
          "chgp": "",
          "chgp_class": "neutral"
        },
        {
          "field": "Consolidate Net Profit",
          "val1": "97.33",
          "val2": "78.77",
          "chgp": "23.56%",
          "chgp_class": "positive"
        },
        {
          "field": "Operating Profit Margin (Excl OI)",
          "val1": "18.70%",
          "val2": "17.08%",
          "chgp": "1.62%",
          "chgp_class": "positive"
        }
      ]
    }
  },
  {
    "link": "annual",
    "btn_text": "All Annual Results",
    "header": "Annual Results Snapshot (Consolidated) - Mar'26",
    "rhs": [
      {
        "prefix": "Net Sales ",
        "suffix": "YoY Growth in year ended Mar 2026 is 14.06% vs 15.94% in Mar 2025",
        "dir": -1
      },
      {
        "prefix": "Consolidated Net Profit ",
        "suffix": "YoY Growth in year ended Mar 2026 is 22.49% vs 13.13% in Mar 2025",
        "dir": 1
      }
    ],
    "table": {
      "header": [
        "Mar'26",
        "Mar'25",
        "Change(%)"
      ],
      "body": [
        {
          "field": "Net Sales",
          "val1": "1,007.19",
          "val2": "883.01",
          "chgp": "14.06%",
          "chgp_class": "positive"
        },
        {
          "field": "Operating Profit (PBDIT) excl Other Income",
          "val1": "187.08",
          "val2": "146.25",
          "chgp": "27.92%",
          "chgp_class": "positive"
        },
        {
          "field": "Interest",
          "val1": "8.90",
          "val2": "8.50",
          "chgp": "4.71%",
          "chgp_class": "negative"
        },
        {
          "field": "Exceptional Items",
          "val1": "-4.86",
          "val2": "0.00",
          "chgp": "",
          "chgp_class": "neutral"
        },
        {
          "field": "Consolidate Net Profit",
          "val1": "133.27",
          "val2": "108.80",
          "chgp": "22.49%",
          "chgp_class": "positive"
        },
        {
          "field": "Operating Profit Margin (Excl OI)",
          "val1": "18.57%",
          "val2": "16.56%",
          "chgp": "2.01%",
          "chgp_class": "positive"
        }
      ]
    }
  }
]

Quarterly Results Snapshot (Consolidated) - Jun'26 - YoYstock-summary

Jun'26
Jun'25
Change(%)
Net Sales
248.62
249.07
-0.18%
Operating Profit (PBDIT) excl Other Income
45.40
45.82
-0.92%
Interest
1.26
2.78
-54.68%
Exceptional Items
0.00
0.00
Consolidate Net Profit
29.29
32.35
-9.46%
Operating Profit Margin (Excl OI)
18.26%
18.40%
-0.14%
Values in Rs Cr.
Direction Arrows
Net Sales

YoY Growth in quarter ended Jun 2026 is -0.18% vs 23.91% in Jun 2025

Direction Arrows
Consolidated Net Profit

YoY Growth in quarter ended Jun 2026 is -9.46% vs 26.42% in Jun 2025

Half Yearly Results Snapshot (Consolidated) - Sep'25stock-summary

Sep'25
Sep'24
Change(%)
Net Sales
507.57
416.30
21.92%
Operating Profit (PBDIT) excl Other Income
96.45
71.81
34.31%
Interest
5.09
3.44
47.97%
Exceptional Items
0.00
0.00
Consolidate Net Profit
68.31
51.75
32.00%
Operating Profit Margin (Excl OI)
19.00%
17.25%
1.75%
Values in Rs Cr.
Direction Arrows
Net Sales

Growth in half year ended Sep 2025 is 21.92% vs 11.35% in Sep 2024

Direction Arrows
Consolidated Net Profit

Growth in half year ended Sep 2025 is 32.00% vs 2.62% in Sep 2024

Nine Monthly Results Snapshot (Consolidated) - Dec'25stock-summary

Dec'25
Dec'24
Change(%)
Net Sales
758.35
643.13
17.92%
Operating Profit (PBDIT) excl Other Income
141.83
109.87
29.09%
Interest
7.04
6.02
16.94%
Exceptional Items
-4.86
0.00
Consolidate Net Profit
97.33
78.77
23.56%
Operating Profit Margin (Excl OI)
18.70%
17.08%
1.62%
Values in Rs Cr.
Direction Arrows
Net Sales

YoY Growth in nine months ended Dec 2025 is 17.92% vs 13.48% in Dec 2024

Direction Arrows
Consolidated Net Profit

YoY Growth in nine months ended Dec 2025 is 23.56% vs 7.95% in Dec 2024

Annual Results Snapshot (Consolidated) - Mar'26stock-summary

Mar'26
Mar'25
Change(%)
Net Sales
1,007.19
883.01
14.06%
Operating Profit (PBDIT) excl Other Income
187.08
146.25
27.92%
Interest
8.90
8.50
4.71%
Exceptional Items
-4.86
0.00
Consolidate Net Profit
133.27
108.80
22.49%
Operating Profit Margin (Excl OI)
18.57%
16.56%
2.01%
Values in Rs Cr.
Direction Arrows
Net Sales

YoY Growth in year ended Mar 2026 is 14.06% vs 15.94% in Mar 2025

Direction Arrows
Consolidated Net Profit

YoY Growth in year ended Mar 2026 is 22.49% vs 13.13% in Mar 2025

stock-summaryCompany CV
About Saksoft Ltd stock-summary
stock-summary
Saksoft Ltd
Small Cap
Computers - Software & Consulting
Saksoft Ltd was incorporated on November 24, 1999 with the name Sak Infotech Ltd. In September, 2002, the company changed their name from Sak Infotech Ltd to Saksoft Ltd. The Company is a leading provider of Information Management Solutions to successful companies around the world. The company is a mid-sized Information technology Company and provides end-to-end business solutions that leverage technology and enables their clients to enhance business performance.
Company Coordinates stock-summary
Company Details
SP Infocity Module 1 2nd Flr, No 40 MGR Salai Perungudi Chennai Tamil Nadu : 600096
stock-summary
Tel: 91-44-24543500
stock-summary
info@saksoft.com
Registrar Details
Cameo Corporate Services Ltd , Subramanian Buildings No 1 , Club House Road, Chennai