
Compare Saksoft with Similar Stocks
Dashboard
Despite the size of the company, domestic mutual funds hold only 0% of the company
- Domestic mutual funds have capability to do in-depth on-the-ground research on companies- their small stake may signify either they are not comfortable at the price or the business
Consistent Underperformance against the benchmark over the last 3 years
Stock DNA
Computers - Software & Consulting
INR 2,200 Cr (Small Cap)
16.00
21
0.51%
-0.27
17.59%
2.85
Total Returns (Price + Dividend) 
Latest dividend: 0.4483192231075697 per share ex-dividend date: Nov-14-2025
Risk Adjusted Returns v/s
Returns Beta

News
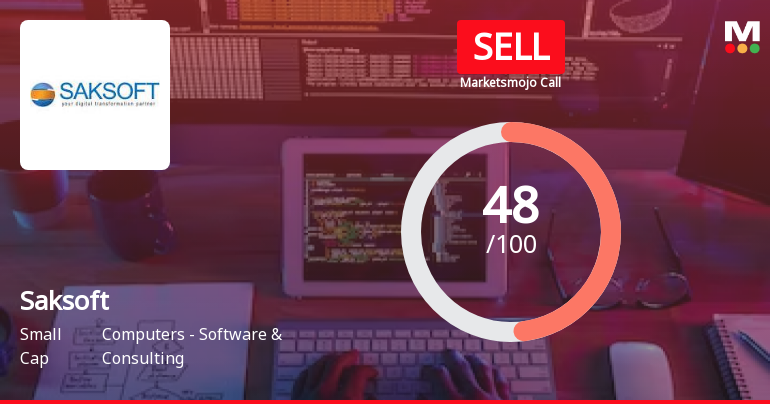
Saksoft Ltd is Rated Sell
Saksoft Ltd is rated Sell by MarketsMOJO, with this rating last updated on 02 July 2026. However, the analysis and financial metrics discussed here reflect the stock’s current position as of 25 July 2026, providing investors with the most up-to-date view of the company’s fundamentals, returns, and market standing.
Read full news article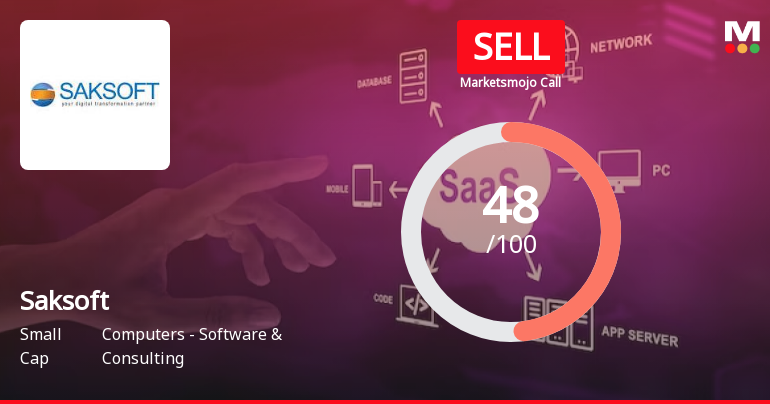
Saksoft Ltd is Rated Sell
Saksoft Ltd is rated 'Sell' by MarketsMOJO, with this rating last updated on 02 July 2026. However, the analysis and financial metrics discussed here reflect the stock's current position as of 14 July 2026, providing investors with an up-to-date view of the company’s fundamentals, returns, and market standing.
Read full news article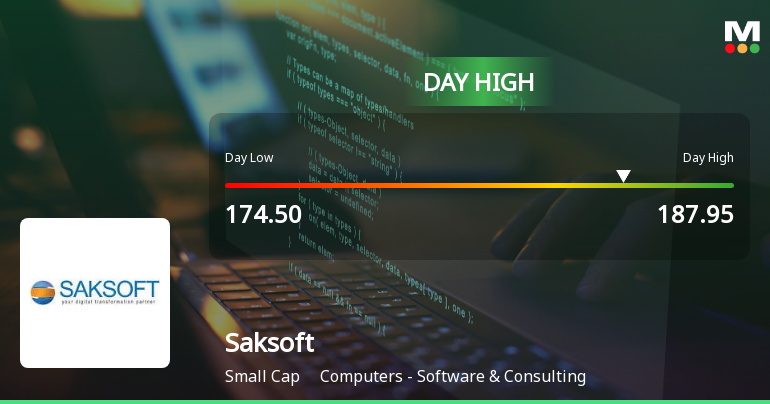
Saksoft Ltd Surges 8.46% to Day's High of Rs 187.95 — Outperforms Sector by 2.96 Percentage Points
The Sensex edged up a modest 0.08% on 13 Jul 2026, while Saksoft Ltd surged 8.46%, reaching an intraday high of Rs 187.95. This 2.96 percentage-point outperformance over the IT - Software sector’s 3.84% gain highlights a distinctly stock-specific rally rather than a broad market lift.
Read full news article Announcements
Saksoft Limited - Press Release
14-Nov-2019 | Source : NSESaksoft Limited has informed the Exchange regarding a press release dated November 13, 2019, titled "Press Release for Unaudited Stanalone and Consolidated Financial Results for 30092019".
Saksoft Limited - Record Date
13-Nov-2019 | Source : NSESaksoft Limited has informed the Exchange that the Company has fixed Record Date as November 25, 2019 for the purpose of Payment of Interim Dividend for FY 2019-20.
Saksoft Limited - Analysts/Institutional Investor Meet/Con. Call Updates
08-Nov-2019 | Source : NSESaksoft Limited has informed the Exchange regarding Analysts/Institutional Investor Meet/Con. Call Updates
Corporate Actions

No Upcoming Board Meetings

Saksoft Ltd has declared 55% dividend, ex-date: 31 Jul 26

Saksoft Ltd has announced 1:10 stock split, ex-date: 23 Sep 22

Saksoft Ltd has announced 1:4 bonus issue, ex-date: 19 Sep 24

No Rights history available
Quality key factors
Valuation key factors
Technicals key factors
 Technical Indicator Scale: Bearish, Mildly Bearish, Sideways, Mildly Bullish, Bullish Turned
 Shareholding Snapshot : Jun 2026
Shareholding Compare (%holding)
Promoters
None
Held by 0 Schemes
Held by 42 FIIs (2.17%)
Sak Industries Private Limited (45.72%)
Sonnet Trade And Investments Private Limited (1.18%)
22.21%
Quarterly Results Snapshot (Consolidated) - Mar'26 - YoY

YoY Growth in quarter ended Mar 2026 is 3.74% vs 23.08% in Mar 2025
YoY Growth in quarter ended Mar 2026 is 19.65% vs 29.44% in Mar 2025
Half Yearly Results Snapshot (Consolidated) - Sep'25

Growth in half year ended Sep 2025 is 21.92% vs 11.35% in Sep 2024
Growth in half year ended Sep 2025 is 32.00% vs 2.62% in Sep 2024
Nine Monthly Results Snapshot (Consolidated) - Dec'25
YoY Growth in nine months ended Dec 2025 is 17.92% vs 13.48% in Dec 2024
YoY Growth in nine months ended Dec 2025 is 23.56% vs 7.95% in Dec 2024
Annual Results Snapshot (Consolidated) - Mar'26
YoY Growth in year ended Mar 2026 is 14.06% vs 15.94% in Mar 2025
YoY Growth in year ended Mar 2026 is 22.49% vs 13.13% in Mar 2025
About Saksoft Ltd

Company Coordinates


