
Compare Capital Trust with Similar Stocks
Dashboard
Weak Long Term Fundamental Strength with an average Return on Equity (ROE) of 0.82%
- Poor long term growth as Net Sales has grown by an annual rate of -17.49% and Operating profit at -225.37%
The company has declared Negative results for the last 4 consecutive quarters
Risky - Negative EBITDA
Underperformed the market in the last 1 year
Stock DNA
Non Banking Financial Company (NBFC)
INR 45 Cr (Micro Cap)
NA (Loss Making)
21
0.00%
0.65
-76.14%
0.73
Total Returns (Price + Dividend) 
Latest dividend: 0.5 per share ex-dividend date: Sep-20-2019
Risk Adjusted Returns v/s
Returns Beta

News

Capital Trust Ltd is Rated Strong Sell
Capital Trust Ltd is rated Strong Sell by MarketsMOJO. This rating was last updated on 27 Nov 2024, reflecting a significant reassessment of the stock’s outlook. However, the analysis below is based on the company’s current position as of 18 June 2026, incorporating the latest fundamentals, returns, and financial metrics to provide investors with an up-to-date perspective.
Read full news article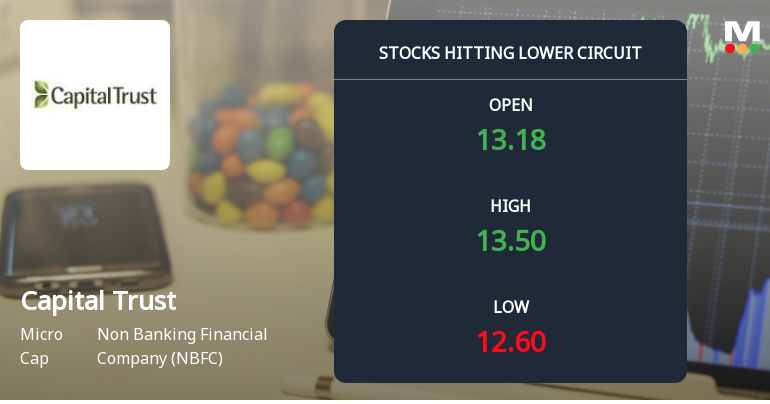
Capital Trust Ltd Locks at Lower Circuit With 4.2% Loss — Sellers Queue, No Buyers in Sight
At Rs 12.45, sellers were still queuing — but there were no buyers willing to take the other side. Capital Trust Ltd locked at its lower circuit of 4.2% on 11 Jun 2026, with unfilled sell orders and a frozen price, reflecting persistent selling pressure in a micro-cap stock with limited liquidity.
Read full news article
Capital Trust Ltd Locks at Lower Circuit With 4.54% Loss — Sellers Queue, No Buyers in Sight
At Rs 13.10, sellers were still queuing — but there were no buyers willing to take the other side. Capital Trust Ltd locked at its lower circuit of 4.54% on 10 Jun 2026, with unfilled sell orders and a frozen price.
Read full news article Announcements
Capital Trust Limited - Financial Results
06-Nov-2019 | Source : NSECapital Trust Limited has informed the Exchange that the Companies (Indian Accounting Standards) rules, 2015 (Ind AS) is applicable to our company from the Accounting period beginning on or after 1st April, 2019. In pursuant to SEBI circular CIR/CFD/FAC/62/2016 dated 5th July 2016, the company is availing the relaxation given by it for extending the Board Meeting and approving the Financial Results by one month and the meeting will be held on or before 14th December, 2019. The date of Board meeting for approving the Financial Result will be intimating to you shortly.
Capital Trust Limited - Clarification
09-Oct-2019 | Source : NSECapital Trust Limited with respect to announcement dated 25-Sep-2019, regarding revision of rating of the company from Care BBB+ to Care BBB for the various borrowings and NCDs. On basis of above the Company is required to clarify following: 1. In case of downward rating, the disclosure may include reasons published by rating agency for such downward rating. The response of the Company is awaited.
Capital Trust Limited - Credit Rating
25-Sep-2019 | Source : NSECapital Trust Limited has informed the Exchange regarding Credit Rating revision of rating of the company from Care BBB+ to Care BBB for the various borrowings and NCDs.
Corporate Actions

No Upcoming Board Meetings

Capital Trust Ltd has declared 5% dividend, ex-date: 20 Sep 19

No Splits history available

No Bonus history available

Capital Trust Ltd has announced 1:1 rights issue, ex-date: 10 Oct 25
Quality key factors
Valuation key factors
Technicals key factors
 Technical Indicator Scale: Bearish, Mildly Bearish, Sideways, Mildly Bullish, Bullish Turned
 Shareholding Snapshot : Mar 2026
Shareholding Compare (%holding)
Promoters
None
Held by 1 Schemes (0.0%)
Held by 0 FIIs
Yogen Khosla (36.96%)
India 2020 Ii Investors,limited (7.12%)
32.17%
Quarterly Results Snapshot (Standalone) - Dec'25 - YoY

YoY Growth in quarter ended Dec 2025 is -55.18% vs 30.27% in Dec 2024
YoY Growth in quarter ended Dec 2025 is -4,150.00% vs -89.09% in Dec 2024
Half Yearly Results Snapshot (Standalone) - Sep'25
Growth in half year ended Sep 2025 is -57.48% vs 35.18% in Sep 2024
Growth in half year ended Sep 2025 is -2,802.06% vs -2.02% in Sep 2024
Nine Monthly Results Snapshot (Standalone) - Dec'25
YoY Growth in nine months ended Dec 2025 is -56.71% vs 33.50% in Dec 2024
YoY Growth in nine months ended Dec 2025 is -2,880.58% vs -33.12% in Dec 2024
Annual Results Snapshot (Standalone) - Mar'26
YoY Growth in year ended Mar 2026 is -56.15% vs 21.96% in Mar 2025
YoY Growth in year ended Mar 2026 is -4,318.02% vs -48.37% in Mar 2025
About Capital Trust Ltd

Company Coordinates


