
 Upcoming Result: P & G Health Ltd will declare its result soon on 26 May 2026Technical Trend Update: P & G Health Ltd witnessed a change in Technical Grade on 22 May 2026. Click here to discover latest technical change!Mojo Score Change: P & G Health Ltd has changed its score on 22 May 2026. Click here to unlock latest mojo score!
 Price Point
Compare P & G Health Ltd with Similar Stocks
ScoreDashboard
High Management Efficiency with a high ROE of 36.14%
The company is Net-Debt Free
Poor long term growth as Net Sales has grown by an annual rate of 7.63% and Operating profit at 8.59% over the last 5 years
Flat results in Dec 25
With ROE of 47.4, it has a Very Expensive valuation with a 14.9 Price to Book Value
Falling Participation by Institutional Investors
Mojo ParametersStock DNA

Pharmaceuticals & Biotechnology

INR 9,312 Cr (Small Cap)

31.00
34

3.69%

-0.45

47.36%

14.90
Total ReturnsTotal Returns (Price + Dividend) 
Latest dividend: 110 per share ex-dividend date: Feb-12-2026
Risk Adjusted Returns v/s
Returns Beta
 News & Corporate Actions
News
Procter & Gamble Health Ltd Upgraded to Hold on Technical Improvements and Valuation Concerns
Procter & Gamble Health Ltd has seen its investment rating upgraded from Sell to Hold as of 22 May 2026, reflecting a nuanced improvement across technical indicators and valuation metrics despite flat financial performance. The company’s technical trend has shifted to mildly bullish, while valuation concerns remain tempered by strong management efficiency and a net-debt-free balance sheet.
Read full news article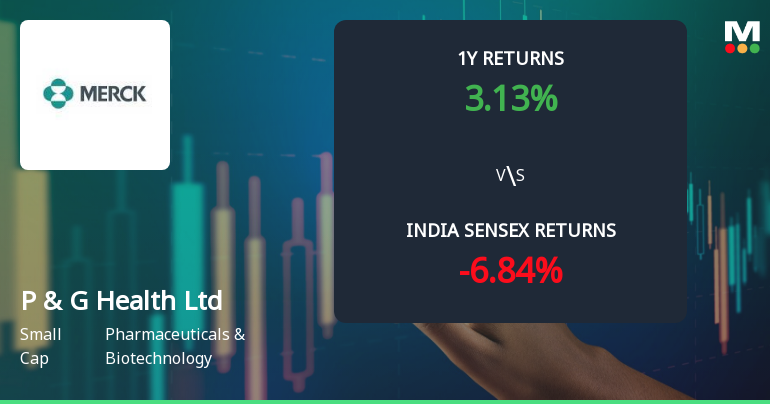
Procter & Gamble Health Ltd Sees Technical Momentum Shift Amid Mixed Indicator Signals
Procter & Gamble Health Ltd (P&G Health) has recently exhibited a shift in price momentum, moving from a sideways trend to a mildly bullish stance according to key technical indicators. Despite some mixed signals across weekly and monthly charts, the stock’s recent performance and technical parameters suggest cautious optimism for investors in the Pharmaceuticals & Biotechnology sector.
Read full news article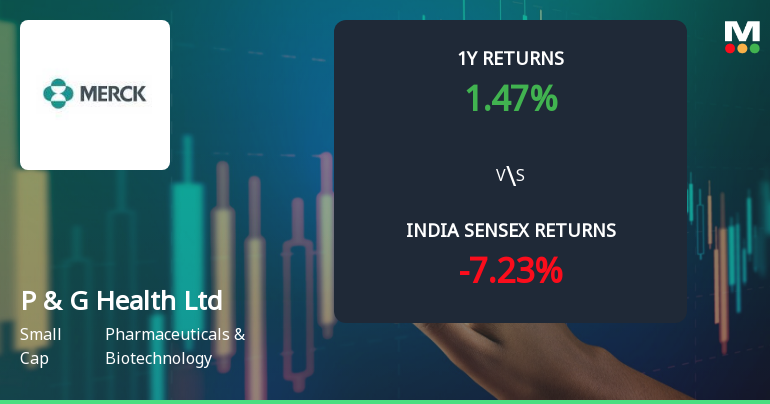
Procter & Gamble Health Ltd Technical Momentum Shifts Amid Mixed Market Signals
Procter & Gamble Health Ltd (P&G Health), a small-cap player in the Pharmaceuticals & Biotechnology sector, has experienced a nuanced shift in its technical momentum, moving from a mildly bearish stance to a sideways trend. Despite a modest day decline of 0.09%, the stock’s technical indicators reveal a complex interplay of bullish and bearish signals, prompting a reassessment of its near-term outlook.
Read full news article Announcements
Procter & Gamble Health Limited - Updates
14-Nov-2019 | Source : NSEProcter & Gamble Health Limited has informed the Exchange regarding 'Updation of Company's and Investor's Helpline numbers'.
Procter & Gamble Health Limited - Outcome of Board Meeting
08-Nov-2019 | Source : NSEProcter & Gamble Health Limited has informed the Exchange regarding Board meeting held on November 07, 2019.
Related Party Transactions
06-Sep-2019 | Source : NSE
| Procter & Gamble Health Limited has informed the Exchange that regarding Related Party Transactions for six months ended June 30, 2019. |
Corporate Actions

26 May 2026

Procter & Gamble Health Ltd has declared 1100% dividend, ex-date: 12 Feb 26

No Splits history available

No Bonus history available

No Rights history available
Key FactorsQuality key factors
Valuation key factors
Technicals key factors
Technical Indicator Scale: Bearish, Mildly Bearish, Sideways, Mildly Bullish, Bullish Turned ShareholdingShareholding Snapshot : Mar 2026
Shareholding Compare (%holding)
Promoters
None
Held by 11 Schemes (10.2%)
Held by 119 FIIs (6.2%)
Procter And Gamble Overseas India B.v. (51.82%)
Nippon Life India Trustee Ltd-a/c Nippon India Sma (4.17%)
23.17%
FinancialQuarterly Results Snapshot (Standalone) - Dec'25 - YoY
 Compare with Peers
YoY Growth in quarter ended Dec 2025 is 20.69% vs -0.06% in Dec 2024

YoY Growth in quarter ended Dec 2025 is -14.64% vs 26.13% in Dec 2024

Half Yearly Results Snapshot (Standalone) - Sep'25
Not Applicable: The company has declared_date for only one period
Not Applicable: The company has declared_date for only one period
Nine Monthly Results Snapshot (Standalone) - Dec'25
YoY Growth in nine months ended Dec 2025 is 14.38% vs 4.57% in Dec 2024
YoY Growth in nine months ended Dec 2025 is 22.26% vs 3.15% in Dec 2024
Annual Results Snapshot (Standalone) - Jun'24
YoY Growth in year ended Jun 2024 is -6.37% vs 10.34% in Jun 2023
YoY Growth in year ended Jun 2024 is -12.42% vs 19.19% in Jun 2023
 Company CV
About Procter & Gamble Health Ltd

Company Coordinates










