
Compare Vidhi Specialty with Similar Stocks
Dashboard
Poor long term growth as Net Sales has grown by an annual rate of 7.36% and Operating profit at 6.73% over the last 5 years
Flat results in Mar 26
With ROCE of 18.8, it has a Very Expensive valuation with a 4 Enterprise value to Capital Employed
Despite the size of the company, domestic mutual funds hold only 0% of the company
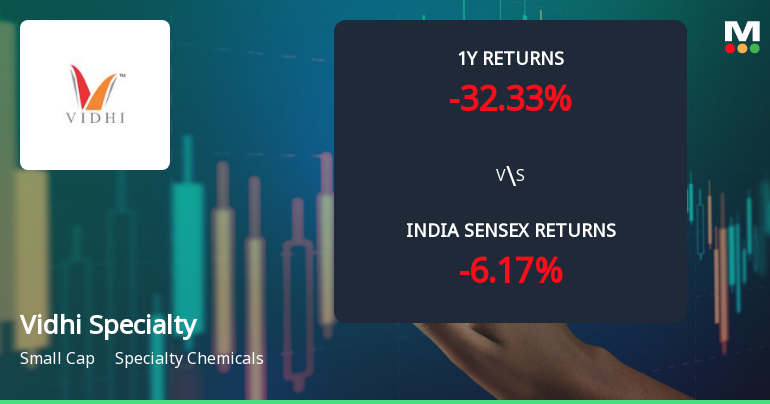
Consistent Underperformance against the benchmark over the last 3 years
Stock DNA
Specialty Chemicals
INR 1,426 Cr (Small Cap)
29.00
20
1.58%
0.11
14.89%
4.34
Total Returns (Price + Dividend) 
Latest dividend: 1.4872340425531916 per share ex-dividend date: Nov-14-2025
Risk Adjusted Returns v/s
Returns Beta

News
Vidhi Specialty Food Ingredients Ltd Sees Mixed Technical Signals Amid Price Momentum Shift
Vidhi Specialty Food Ingredients Ltd, a small-cap player in the specialty chemicals sector, has experienced a notable shift in its technical momentum, reflecting a complex interplay of bearish and mildly bullish signals. Despite a recent downgrade from Hold to Sell by MarketsMOJO, the stock’s technical indicators reveal nuanced trends that merit close attention from investors navigating a challenging market environment.
Read full news article
Vidhi Specialty Food Ingredients Ltd is Rated Sell
Vidhi Specialty Food Ingredients Ltd is rated 'Sell' by MarketsMOJO, with this rating last updated on 24 Mar 2025. However, the analysis and financial metrics discussed here reflect the stock's current position as of 06 July 2026, providing investors with an up-to-date perspective on the company’s fundamentals, valuation, financial trends, and technical outlook.
Read full news article
Vidhi Specialty Food Ingredients Ltd Faces Bearish Momentum Amid Technical Downgrade
Vidhi Specialty Food Ingredients Ltd has experienced a marked shift in price momentum, with technical indicators signalling a bearish trend across multiple timeframes. The company’s shares, currently trading at ₹279.05, have declined by 2.21% today, reflecting growing investor caution amid deteriorating technical signals and a downgrade in its Mojo Grade from Hold to Sell.
Read full news article Announcements
Vidhi Specialty Food Ingredients Limited - Updates
14-Nov-2019 | Source : NSEVidhi Specialty Food Ingredients Limited has informed the Exchange regarding 'Copy of publication of Un-audited Financial Results for the quarter and half year ended September 30, 2019 in Newspapers'.
Vidhi Specialty Food Ingredients Limited - Record Date
13-Nov-2019 | Source : NSEVidhi Specialty Food Ingredients Limited has informed the Exchange that the Company has fixed Record Date as November 22, 2019 for the purpose of 2nd Interim Dividend.
Vidhi Specialty Food Ingredients Limited - Updates
16-Oct-2019 | Source : NSEVidhi Specialty Food Ingredients Limited has informed the Exchange regarding 'Newspaper advertisement for Transfer of Equity Shares of the Company to Investor Education and Protection Fund (IEPF) Authority'. Pursuant to Regulation 47 and Regulation 30(4) read with Schedule III (A) (12) of the Securities and Exchange Board of India (Listing Obligations and Disclosure Requirements) Regulations, 2015, we hereby enclose copies of the Notice to the Shareholders published in the Business Standard (English Newspaper) and Mumbai Lakshadeep (Marathi Newspaper) on October 16, 2019, pursuant to Rule 6 IEPF Authority (Accounting, Audit, Transfer and Refund) Rules, 2016 and amendments thereof.
Corporate Actions

No Upcoming Board Meetings

Vidhi Specialty Food Ingredients Ltd has declared 150% dividend, ex-date: 14 Nov 25

No Splits history available

No Bonus history available

No Rights history available
Quality key factors
Valuation key factors
Technicals key factors
 Technical Indicator Scale: Bearish, Mildly Bearish, Sideways, Mildly Bullish, Bullish Turned
 Shareholding Snapshot : Mar 2026
Shareholding Compare (%holding)
Promoters
None
Held by 1 Schemes (0.0%)
Held by 10 FIIs (0.12%)
Pravinamanekfamilyprivatetrust(trusteesbipinmadhavjimanekpravinabipinmanekandmihirbipinmanek) (26.03%)
Mukul Mahavir Agrawal (1.6%)
27.28%
Quarterly Results Snapshot (Consolidated) - Mar'26 - QoQ

QoQ Growth in quarter ended Mar 2026 is 29.89% vs 25.95% in Dec 2025

QoQ Growth in quarter ended Mar 2026 is 5.88% vs 17.61% in Dec 2025
Half Yearly Results Snapshot (Consolidated) - Sep'25
Growth in half year ended Sep 2025 is -6.52% vs 9.04% in Sep 2024
Growth in half year ended Sep 2025 is 23.92% vs 8.00% in Sep 2024
Nine Monthly Results Snapshot (Consolidated) - Dec'25
YoY Growth in nine months ended Dec 2025 is -5.66% vs 22.44% in Dec 2024
YoY Growth in nine months ended Dec 2025 is 13.27% vs 21.29% in Dec 2024
Annual Results Snapshot (Consolidated) - Mar'26
YoY Growth in year ended Mar 2026 is -0.59% vs 28.30% in Mar 2025
YoY Growth in year ended Mar 2026 is 12.81% vs 19.07% in Mar 2025
About Vidhi Specialty Food Ingredients Ltd

Company Coordinates


