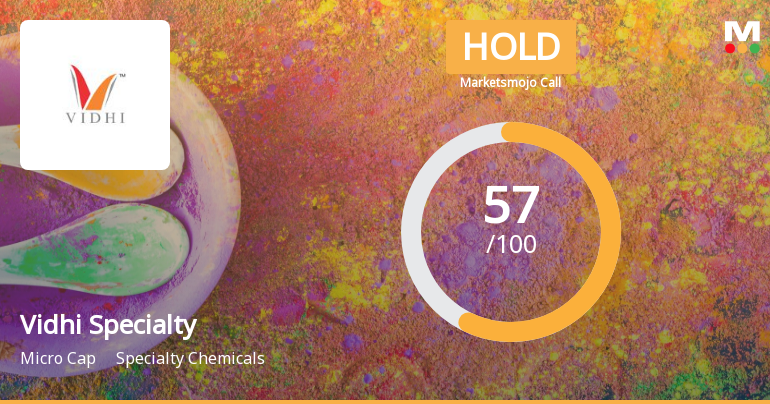
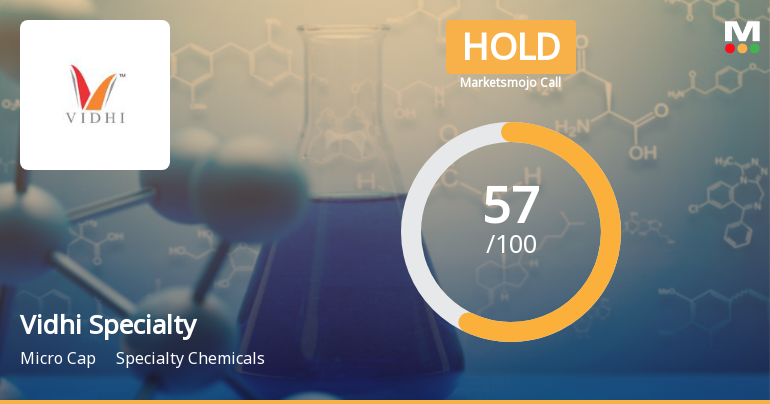
Vidhi Specialty

  • Market Cap: Micro Cap
  • Industry: Specialty Chemicals
  • ISIN: INE632C01026
  • NSEID: VIDHIING
  • BSEID: 531717
INR
344.55
-3.75 (-1.08%)
BSENSE

Sep 18, 03:30 PM

BSE+NSE Vol: 24.97 k

  • Price Points
  • Score
  • Mojo Parameters
  • Total Return
  • News and Corporate Actions
  • Key factors
  • Shareholding
  • Financials
  • CompanyCV
stock-summaryPrice Point
High/Low

1Day

52 Week

Valuation
Technical
Day's Volume

CASH

24.97 k (-12.39%) Volume

Shareholding (Jun 2026)

FII

0.07%

Held by 10 FIIs

DII

0.04%

Held by 0 DIIs

Promoter

64.27%

Why is Vidhi Specialty Food Ingredients Ltd falling/rising?

06-Sep-2026

As of 05-Sep, Vidhi Specialty Food Ingredients Ltd's stock price is slightly rising at 345.75, but it has faced declines over longer periods and decreased investor participation. Despite recent gains, the stock's performance remains mixed compared to benchmarks and moving averages.

As of 05-Sep, Vidhi Specialty Food Ingredients Ltd's stock price is rising slightly, currently at 345.75, with a change of 0.15 (0.04%) increase. The stock has shown a positive performance today, outperforming its sector by 0.73%. Additionally, it has been gaining for the last two days, accumulating a total return of 1.11% during this period. <BR><BR>Despite the recent rise, the stock has experienced a decline over longer periods, with a 1W return of -3.21% and a 1Y return of -10.62%. However, it has performed better than the benchmark Sensex over the past month, with a return of +4.46% compared to the Sensex's -2.44%. <BR><BR>The stock's current price is higher than its 20-day, 50-day, 100-day, and 200-day moving averages, indicating a relatively strong position in the short term. However, it is lower than its 5-day moving average, suggesting some volatility. <BR><BR>Investor participation has decreased significantly, with a delivery volume drop of -88.31% against the 5-day average, which may indicate reduced interest among investors. Despite this decline in participation, the stock remains liquid enough for trading, based on its average traded value. <BR><BR>In summary, while Vidhi Specialty Food Ingredients Ltd is currently experiencing a slight rise in stock price, it faces challenges with declining investor participation and mixed performance over longer periods.

View full answer

Should I buy, sell or hold Vidhi Specialty Food Ingredients Ltd?

05-Sep-2026

Who are in the management team of Vidhi Specialty?

01-Sep-2026

The management team of Vidhi Specialty includes Bipin M Manek (Chairman & Managing Director), Mihir B Manek (Joint Managing Director), and several directors, along with independent directors responsible for governance and strategic direction.

The management team of Vidhi Specialty includes the following individuals:<BR><BR>1. **Bipin M Manek** - Chairman & Managing Director<BR>2. **Mihir B Manek** - Joint Managing Director<BR>3. **Pravina B Manek** - Director<BR>4. **Vijay K Atre** - Director<BR>5. **Vidhi Harsh Parekh** - Whole-time Director<BR>6. **Priyanka Soni** - Company Secretary<BR>7. **Vishakha Pandya** - Company Secretary & Compliance Officer<BR><BR>Additionally, the board includes several independent directors:<BR><BR>1. **Prafulchandra A Shah** - Independent Director<BR>2. **Niren D Desai** - Independent Director<BR>3. **Rahul Berde** - Independent Director<BR>4. **Ashit Kantilal Doshi** - Independent Director<BR>5. **Jyoti Sunil Modi** - Independent Director<BR><BR>This team is responsible for overseeing the strategic direction and governance of the company.

View full answer

What does Vidhi Specialty do?

01-Sep-2026

Vidhi Specialty Food Ingredients Ltd manufactures and trades synthetic food colors and chemicals, classified as a micro-cap company with a market cap of INR 1,775 Cr. As of June 2026, it reported net sales of 146 Cr and a net profit of 17 Cr.

Overview: <BR>Vidhi Specialty Food Ingredients Ltd is engaged in the manufacturing and trading of synthetic food colors and chemicals within the specialty chemicals industry, classified as a micro-cap company.<BR><BR>History: <BR>The company was incorporated on 19th January, 1994, and was formerly known as Vidhi Dyestuffs Manufacturing Limited. The latest quarterly results reported net sales and profit for June 2026.<BR><BR>Financial Snapshot: <BR>- Net Sales: 146 Cr (Quarterly Results - Jun 2026) <BR>- Net Profit: 17 Cr (Quarterly Results - Jun 2026) <BR>- Market-cap: INR 1,775 Cr (Micro Cap) <BR><BR>Key Metrics: <BR>- P/E: 33.00 <BR>- Industry P/E: 18 <BR>- Dividend Yield: 0.84% <BR>- Debt Equity: 0.11 <BR>- Return on Equity: 14.89% <BR>- Price to Book: 5.42 <BR><BR>Contact Details: <BR>Address: E/27 Commerce Centre, 78 Tardeo Road Mumbai Maharashtra : 400034 <BR>Tel: 91-022-61406666 <BR>Email: info@vidhifood.com <BR>Website: http://www.vidhifoodcolours.com

View full answer

Who are the peers of the Vidhi Specialty?

01-Sep-2026

Vidhi Specialty's peers include NOCIL, Rossari Biotech, S H Kelkar & Co., Camlin Fine, Paushak, Indokem, Titan Biotech, Oriental Aromat, and Nitta Gelatin. In terms of management risk, growth, and capital structure, Vidhi Specialty ranks similarly to several peers, with a 1-year return of -5.54%.

Peers: The peers of Vidhi Specialty are NOCIL, Rossari Biotech, S H Kelkar & Co., Camlin Fine, Paushak, Indokem, Titan Biotech, Oriental Aromat., and Nitta Gelatin.<BR><BR>Quality Snapshot: Excellent management risk is observed at NOCIL, Rossari Biotech, Paushak, Titan Biotech, Nitta Gelatin, and Vidhi Specialty, while Average management risk is found at S H Kelkar & Co., Indokem, and Oriental Aromat. Below Average management risk is present at Camlin Fine and Indokem. In terms of Growth, Excellent growth is noted at Paushak, while Average growth is found at Rossari Biotech and Nitta Gelatin. Below Average growth is observed at NOCIL, S H Kelkar & Co., Camlin Fine, Vidhi Specialty, Indokem, Titan Biotech, and Oriental Aromat. Capital Structure is Excellent for NOCIL, Rossari Biotech, Paushak, Vidhi Specialty, Titan Biotech, and Nitta Gelatin, while Average is noted for S H Kelkar & Co. and Below Average for Camlin Fine, Indokem, and Oriental Aromat.<BR><BR>Return Snapshot: The peer with the highest 1-year return is Titan Biotech at 160.06%, while the lowest is Camlin Fine at -49.11%. Vidhi Specialty's 1-year return is -5.54%, which is higher than Camlin Fine but lower than Titan Biotech. Additionally, the peers with a negative six-month return include Rossari Biotech and Camlin Fine.

View full answer

How big is Vidhi Specialty?

01-Sep-2026

As of 31st August, Vidhi Specialty Food Ingredients Ltd has a market capitalization of 1,775.00 Cr, with recent net sales of 438.40 Cr and a net profit of 53.25 Cr. Shareholder's funds are valued at 301.09 Cr, and total assets amount to 396.06 Cr.

As of 31st August, Vidhi Specialty Food Ingredients Ltd has a market capitalization of 1,775.00 Cr, categorizing it as a Micro Cap company.<BR><BR>In the latest four quarters, the company reported Net Sales of 438.40 Cr and a Net Profit of 53.25 Cr.<BR><BR>For the latest annual period ending in March 2025, Shareholder's Funds were valued at 301.09 Cr, while Total Assets amounted to 396.06 Cr.

View full answer

Are Vidhi Specialty Food Ingredients Ltd latest results good or bad?

30-Jul-2026

Vidhi Specialty Food Ingredients Ltd reported strong quarterly net sales and profit growth, with net sales up 66.42% year-on-year. However, concerns over margin compression led to a 3.68% decline in stock price, indicating potential challenges in sustaining this growth.

Vidhi Specialty Food Ingredients Ltd's latest results present a mixed picture. On one hand, the company reported impressive quarterly net sales of ₹146.28 crores for Q1 FY27, which is a significant sequential growth of 19.24% compared to the previous quarter and a remarkable 66.42% increase year-on-year. Additionally, net profit rose by 34.80% to ₹17.12 crores.<BR><BR>However, despite these strong revenue and profit figures, the stock experienced a decline of 3.68% following the results announcement, closing at ₹300.65. This drop can be attributed to concerns over margin compression. The operating margin fell to 17.78%, down 556 basis points from the previous year, indicating that the company's aggressive growth may be impacting its pricing power and operational efficiency. Similarly, the profit after tax (PAT) margin also decreased to 11.70%, reflecting a deterioration in profitability metrics.<BR><BR>In summary, while the revenue growth is commendable, the significant margin compression raises concerns about the sustainability of this growth and the company's competitive positioning. Investors may need to weigh these factors carefully when assessing the overall performance of Vidhi Specialty Food Ingredients Ltd.

View full answer

When is the next results date for Vidhi Specialty Food Ingredients Ltd?

23-Jul-2026

The next results date for Vidhi Specialty Food Ingredients Ltd is July 29, 2026.

The next results date for Vidhi Specialty Food Ingredients Ltd is scheduled for July 29, 2026.

View full answer

Is Vidhi Specialty technically bullish or bearish?

03-Dec-2025

As of December 2, 2025, Vidhi Specialty's technical trend has shifted to a bearish stance with moderate strength, driven by bearish signals from daily moving averages and monthly MACD, despite some mildly bullish indicators on the weekly timeframe.

As of 2 December 2025, the technical trend for Vidhi Specialty has changed from mildly bearish to bearish. The current stance is bearish with moderate strength. Key indicators driving this include the bearish signals from the daily moving averages and the monthly MACD, which is also bearish. The weekly Bollinger Bands confirm a bearish trend, while the Dow Theory indicates a mildly bearish stance on the weekly timeframe. Despite some mildly bullish signals from the weekly MACD and KST, the overall technical picture remains negative.

View full answer

Has Vidhi Specialty declared dividend?

12-Nov-2025

Vidhi Specialty Food Ingredients Ltd has declared a 150% dividend, with an ex-date of November 14, 2025. While the dividend yield is 1.58%, total returns have been mixed, showing negative performance in shorter periods but a strong positive return of 176.37% over five years.

Vidhi Specialty Food Ingredients Ltd has declared a 150% dividend.<BR><BR>Dividend Details:<BR>- Percentage announced: 150%<BR>- Ex-date: 14 Nov 25<BR><BR>Dividend Yield: 1.58%.<BR><BR>Total Returns by Period:<BR>In the 3 Months period, the price return was -10.33%, the dividend return was 0.78%, resulting in a total return of -9.55%.<BR><BR>In the 6 Months period, the price return was -25.4%, the dividend return was 1.02%, leading to a total return of -24.38%.<BR><BR>For the 1 Year period, the price return was -29.31%, the dividend return was 1.44%, culminating in a total return of -27.87%.<BR><BR>During the 2 Years period, the price return was -19.5%, the dividend return was 2.16%, resulting in a total return of -17.34%.<BR><BR>In the 3 Years period, the price return was -9.22%, the dividend return was 2.81%, leading to a total return of -6.41%.<BR><BR>For the 4 Years period, the price return was -0.1%, the dividend return was 3.34%, resulting in a total return of 3.24%.<BR><BR>In the 5 Years period, the price return was 166.88%, the dividend return was 9.49%, culminating in a total return of 176.37%.<BR><BR>Overall, while Vidhi Specialty has declared a significant dividend, the total returns over various periods show a mixed performance, with negative returns in the shorter terms but a strong positive return over the five-year period.

View full answer

How has been the historical performance of Vidhi Specialty?

12-Nov-2025

Vidhi Specialty's historical performance has shown fluctuations, with net sales peaking at 537.05 Cr in Mar'22 before declining to 382.30 Cr in Mar'25, while profitability metrics like operating profit and profit after tax also decreased during this period. Despite growth in total assets from 186.37 Cr in Mar'20 to 396.06 Cr in Mar'25, cash flow from operating activities turned negative in Mar'25.

Answer:<BR>The historical performance of Vidhi Specialty shows fluctuations in key financial metrics over the years.<BR><BR>Breakdown:<BR>Vidhi Specialty's net sales have varied significantly, with a peak of 537.05 Cr in Mar'22, followed by a decline to 382.30 Cr in Mar'25. The total operating income mirrored this trend, reaching 403.99 Cr in Mar'23 before dropping to 382.30 Cr in Mar'25. The company's total expenditure, excluding depreciation, was highest in Mar'22 at 452.45 Cr, but decreased to 313.83 Cr in Mar'25. Operating profit, which peaked at 84.60 Cr in Mar'22, fell to 68.47 Cr in Mar'25, while profit before tax showed a similar decline from 78.96 Cr in Mar'22 to 59.99 Cr in Mar'25. Profit after tax also decreased from 58.57 Cr in Mar'22 to 43.40 Cr in Mar'25. On the balance sheet, total assets increased from 186.37 Cr in Mar'20 to 396.06 Cr in Mar'25, with total liabilities also rising from 186.37 Cr to 396.06 Cr in the same period. The cash flow from operating activities turned negative in Mar'25 at -4.00 Cr, contrasting with a positive cash flow of 71.00 Cr in Mar'24. Overall, while Vidhi Specialty has seen growth in assets and some recovery in sales, profitability metrics have shown a downward trend in recent years.

View full answer

Who are the top shareholders of the Vidhi Specialty?

17-Jul-2025

The top shareholders of Vidhi Specialty include the Pravinamanek Family Private Trust with 26.03%, individual investors with 27.29%, and Mukul Mahavir Agrawal as the largest public shareholder at 1.6%. Additionally, 13 Foreign Institutional Investors hold a combined 0.11%, and no mutual funds currently own shares.

The top shareholders of Vidhi Specialty include the promoters, who hold the majority of the shares. The promoter with the highest holding is the Pravinamanek Family Private Trust, which owns 26.03% of the company. Additionally, individual investors collectively hold 27.29% of the shares. In terms of public shareholders, Mukul Mahavir Agrawal is the highest with a holding of 1.6%. There are also 13 Foreign Institutional Investors (FIIs) that hold a combined 0.11% of the shares, while no mutual funds currently hold shares in the company.

View full answer

Is Vidhi Specialty overvalued or undervalued?

09-Jun-2025

As of May 31, 2023, Vidhi Specialty is considered very expensive and overvalued with a PE ratio of 48.06, significantly higher than its peers, and has underperformed the Sensex with a year-to-date return of -19.10%.

As of 31 May 2023, the valuation grade for Vidhi Specialty has moved from expensive to very expensive, indicating a significant increase in perceived valuation. The company is currently considered overvalued, with a PE ratio of 48.06, a Price to Book Value of 6.93, and an EV to EBITDA of 31.06. These ratios suggest that the stock is trading at a premium compared to its earnings and book value.<BR><BR>In comparison to its peers, Vidhi Specialty's PE ratio is notably higher than Sudarshan Chemicals, which has a PE of 71.32, and significantly above Kiri Industries, which stands at 13.72. This disparity highlights the overvaluation of Vidhi Specialty within the specialty chemicals sector. Additionally, the company's recent stock performance has lagged behind the Sensex, with a year-to-date return of -19.10% compared to the Sensex's 5.59%, further reinforcing the notion that the stock is overvalued.

View full answer
iScoreScore
Click here to find our call on this stock
Strong Sell
Sell
Hold
Buy
Strong Buy

Dashboard

1

Strong ability to service debt as the company has a low Debt to EBITDA ratio of 0.74 times

 
2

Poor long term growth as Net Sales has grown by an annual rate of 5.87% and Operating profit at 4.95% over the last 5 years

 
3

Positive results in Jun 26

4

With ROCE of 18.8, it has a Very Expensive valuation with a 4.9 Enterprise value to Capital Employed

5

Despite the size of the company, domestic mutual funds hold only 0% of the company

6

Consistent Underperformance against the benchmark over the last 3 years

stock-summaryMojo Parameters

Mojo Parameters

Loading Valuation Snapshot...

Stock DNA

stock-summary
Industry

Specialty Chemicals

stock-summary
Market cap

INR 1,733 Cr (Micro Cap)

stock-summary
P/E

33.00

stock-summary
Industry P/E

19

stock-summary
Dividend Yield

0.87%

stock-summary
Debt Equity

0.11

stock-summary
Return on Equity

14.89%

stock-summary
Price to Book

5.26

Revenue and Profits:
Net Sales:
146 Cr
(Quarterly Results - Jun 2026)
Net Profit:
17 Cr
stock-summaryTotal Returns
Total Returns (Price + Dividend) stock-summary
Dividend Yield (0.87%)
TimePeriod
Price Return
Dividend Return
Total Return
3 Months
21.09%
0%
21.09%
6 Months
24.3%
0%
24.3%
1 Year
-8.29%
0.41%
-7.88%
2 Years
-22.51%
1.38%
-21.13%
3 Years
-18.83%
2.38%
-16.45%
4 Years
-17.54%
2.84%
-14.7%
5 Years
-6.21%
3.16%
-3.05%

Latest dividend: 1.5 per share ex-dividend date: Nov-14-2025

Risk Adjusted Returns v/s stock-summary
Returns Beta
Icon
Beta has not been calculated since enough price history is not available
stock-summaryNews & Corporate Actions

News

Vidhi Specialty Food Ingredients Ltd Declines 3.38% Despite Technical Upgrade: Key Weekly Insights

Announcements stock-summary

Vidhi Specialty Food Ingredients Limited - Updates

14-Nov-2019 | Source : NSE

Vidhi Specialty Food Ingredients Limited has informed the Exchange regarding 'Copy of publication of Un-audited Financial Results for the quarter and half year ended September 30, 2019 in Newspapers'.

Vidhi Specialty Food Ingredients Limited - Record Date

13-Nov-2019 | Source : NSE

Vidhi Specialty Food Ingredients Limited has informed the Exchange that the Company has fixed Record Date as November 22, 2019 for the purpose of 2nd Interim Dividend.

Vidhi Specialty Food Ingredients Limited - Updates

16-Oct-2019 | Source : NSE

Vidhi Specialty Food Ingredients Limited has informed the Exchange regarding 'Newspaper advertisement for Transfer of Equity Shares of the Company to Investor Education and Protection Fund (IEPF) Authority'. Pursuant to Regulation 47 and Regulation 30(4) read with Schedule III (A) (12) of the Securities and Exchange Board of India (Listing Obligations and Disclosure Requirements) Regulations, 2015, we hereby enclose copies of the Notice to the Shareholders published in the Business Standard (English Newspaper) and Mumbai Lakshadeep (Marathi Newspaper) on October 16, 2019, pursuant to Rule 6 IEPF Authority (Accounting, Audit, Transfer and Refund) Rules, 2016 and amendments thereof.

Corporate Actions stock-summary

stock-summary
BOARD MEETING

No Upcoming Board Meetings

stock-summary
DIVIDEND

Vidhi Specialty Food Ingredients Ltd has declared 150% dividend, ex-date: 14 Nov 25

stock-summary
SPLITS

No Splits history available

stock-summary
BONUS

No Bonus history available

stock-summary
RIGHTS

No Rights history available

stock-summaryKey Factors

Quality key factors stock-summary

Factor
Value
Sales Growth (5y)
5.87%
EBIT Growth (5y)
4.95%
EBIT to Interest (avg)
17.50
Debt to EBITDA (avg)
0.79
Net Debt to Equity (avg)
0.11
Sales to Capital Employed (avg)
1.25
Tax Ratio
25.56%
Dividend Payout Ratio
40.34%
Pledged Shares
0
Institutional Holding
0.10%
ROCE (avg)
20.47%
ROE (avg)
16.87%

Valuation key factors

Factor
Value
P/E Ratio
33
Industry P/E
19
Price to Book Value
5.29
EV to EBIT
23.85
EV to EBITDA
21.24
EV to Capital Employed
4.85
EV to Sales
4.04
PEG Ratio
2.77
Dividend Yield
0.43%
ROCE (Latest)
18.78%
ROE (Latest)
14.89%

Technicals key factors

Indicator
Weekly
Monthly
MACD
Bullish
Mildly Bullish
RSI
No Signal
No Signal
Bollinger Bands
Bullish
Bearish
Moving Averages
Bullish (Daily)
KST
Bullish
Bearish
Dow Theory
Mildly Bearish
Mildly Bullish
OBV
Mildly Bearish
No Trend
stock-summary Technical Indicator Scale: Bearish, Mildly Bearish, Sideways, Mildly Bullish, Bullish  Turned 
stock-summaryShareholding
Shareholding Snapshot : Jun 2026stock-summary
Shareholding Compare (%holding) stock-summary
Majority shareholders

Promoters

Pledged Promoter Holdings

None

Mutual Funds

Held by 0 Schemes

FIIs

Held by 10 FIIs (0.07%)

Promoter with highest holding

Pravinamanekfamilyprivatetrust(trusteesbipinmadhavjimanekpravinabipinmanekandmihirbipinmanek) (26.03%)

Highest Public shareholder

Miten Mehta (1.44%)

Individual Investors Holdings

27.36%

stock-summaryFinancial
[
  {
    "link": "quarterly",
    "btn_text": "All Quarterly Results",
    "header": "Quarterly Results Snapshot (Consolidated) - Jun'26 - QoQ",
    "rhs": [
      {
        "prefix": "Net Sales ",
        "suffix": "QoQ Growth in quarter ended Jun 2026 is 19.24% vs 29.89% in Mar 2026",
        "dir": -1
      },
      {
        "prefix": "Consolidated Net Profit ",
        "suffix": "QoQ Growth in quarter ended Jun 2026 is 30.19% vs 5.88% in Mar 2026",
        "dir": 1
      }
    ],
    "table": {
      "header": [
        "Jun'26",
        "Mar'26",
        "Change(%)"
      ],
      "body": [
        {
          "field": "Net Sales",
          "val1": "146.28",
          "val2": "122.68",
          "chgp": "19.24%",
          "chgp_class": "positive"
        },
        {
          "field": "Operating Profit (PBDIT) excl Other Income",
          "val1": "26.01",
          "val2": "20.63",
          "chgp": "26.08%",
          "chgp_class": "positive"
        },
        {
          "field": "Interest",
          "val1": "1.02",
          "val2": "1.08",
          "chgp": "-5.56%",
          "chgp_class": "positive"
        },
        {
          "field": "Exceptional Items",
          "val1": "0.00",
          "val2": "0.00",
          "chgp": "",
          "chgp_class": "neutral"
        },
        {
          "field": "Consolidate Net Profit",
          "val1": "17.12",
          "val2": "13.15",
          "chgp": "30.19%",
          "chgp_class": "positive"
        },
        {
          "field": "Operating Profit Margin (Excl OI)",
          "val1": "17.78%",
          "val2": "16.82%",
          "chgp": "0.96%",
          "chgp_class": "positive"
        }
      ]
    }
  },
  {
    "link": "half-yearly",
    "btn_text": "All Half Yearly Results",
    "header": "Half Yearly Results Snapshot (Consolidated) - Sep'25",
    "rhs": [
      {
        "prefix": "Net Sales ",
        "suffix": " Growth in half year ended Sep 2025 is -6.52% vs 9.04% in Sep 2024",
        "dir": -1
      },
      {
        "prefix": "Consolidated Net Profit ",
        "suffix": " Growth in half year ended Sep 2025 is 23.92% vs 8.00% in Sep 2024",
        "dir": 1
      }
    ],
    "table": {
      "header": [
        "Sep'25",
        "Sep'24",
        "Change(%)"
      ],
      "body": [
        {
          "field": "Net Sales",
          "val1": "162.90",
          "val2": "174.26",
          "chgp": "-6.52%",
          "chgp_class": "negative"
        },
        {
          "field": "Operating Profit (PBDIT) excl Other Income",
          "val1": "38.21",
          "val2": "29.31",
          "chgp": "30.37%",
          "chgp_class": "positive"
        },
        {
          "field": "Interest",
          "val1": "2.57",
          "val2": "0.86",
          "chgp": "198.84%",
          "chgp_class": "negative"
        },
        {
          "field": "Exceptional Items",
          "val1": "0.00",
          "val2": "0.00",
          "chgp": "",
          "chgp_class": "neutral"
        },
        {
          "field": "Consolidate Net Profit",
          "val1": "23.26",
          "val2": "18.77",
          "chgp": "23.92%",
          "chgp_class": "positive"
        },
        {
          "field": "Operating Profit Margin (Excl OI)",
          "val1": "23.46%",
          "val2": "16.82%",
          "chgp": "6.64%",
          "chgp_class": "positive"
        }
      ]
    }
  },
  {
    "link": "nine-monthly",
    "btn_text": "All Nine Monthly Results",
    "header": "Nine Monthly Results Snapshot (Consolidated) - Dec'25",
    "rhs": [
      {
        "prefix": "Net Sales ",
        "suffix": "YoY Growth in nine months ended Dec 2025 is -5.66% vs 22.44% in Dec 2024",
        "dir": -1
      },
      {
        "prefix": "Consolidated Net Profit ",
        "suffix": "YoY Growth in nine months ended Dec 2025 is 13.27% vs 21.29% in Dec 2024",
        "dir": -1
      }
    ],
    "table": {
      "header": [
        "Dec'25",
        "Dec'24",
        "Change(%)"
      ],
      "body": [
        {
          "field": "Net Sales",
          "val1": "257.35",
          "val2": "272.78",
          "chgp": "-5.66%",
          "chgp_class": "negative"
        },
        {
          "field": "Operating Profit (PBDIT) excl Other Income",
          "val1": "57.37",
          "val2": "48.40",
          "chgp": "18.53%",
          "chgp_class": "positive"
        },
        {
          "field": "Interest",
          "val1": "3.69",
          "val2": "1.45",
          "chgp": "154.48%",
          "chgp_class": "negative"
        },
        {
          "field": "Exceptional Items",
          "val1": "0.00",
          "val2": "0.00",
          "chgp": "",
          "chgp_class": "neutral"
        },
        {
          "field": "Consolidate Net Profit",
          "val1": "35.68",
          "val2": "31.50",
          "chgp": "13.27%",
          "chgp_class": "positive"
        },
        {
          "field": "Operating Profit Margin (Excl OI)",
          "val1": "22.29%",
          "val2": "17.74%",
          "chgp": "4.55%",
          "chgp_class": "positive"
        }
      ]
    }
  },
  {
    "link": "annual",
    "btn_text": "All Annual Results",
    "header": "Annual Results Snapshot (Consolidated) - Mar'26",
    "rhs": [
      {
        "prefix": "Net Sales ",
        "suffix": "YoY Growth in year ended Mar 2026 is -0.59% vs 28.30% in Mar 2025",
        "dir": -1
      },
      {
        "prefix": "Consolidated Net Profit ",
        "suffix": "YoY Growth in year ended Mar 2026 is 12.81% vs 19.07% in Mar 2025",
        "dir": -1
      }
    ],
    "table": {
      "header": [
        "Mar'26",
        "Mar'25",
        "Change(%)"
      ],
      "body": [
        {
          "field": "Net Sales",
          "val1": "380.03",
          "val2": "382.30",
          "chgp": "-0.59%",
          "chgp_class": "negative"
        },
        {
          "field": "Operating Profit (PBDIT) excl Other Income",
          "val1": "78.00",
          "val2": "68.47",
          "chgp": "13.92%",
          "chgp_class": "positive"
        },
        {
          "field": "Interest",
          "val1": "4.77",
          "val2": "2.48",
          "chgp": "92.34%",
          "chgp_class": "negative"
        },
        {
          "field": "Exceptional Items",
          "val1": "0.00",
          "val2": "0.00",
          "chgp": "",
          "chgp_class": "neutral"
        },
        {
          "field": "Consolidate Net Profit",
          "val1": "48.96",
          "val2": "43.40",
          "chgp": "12.81%",
          "chgp_class": "positive"
        },
        {
          "field": "Operating Profit Margin (Excl OI)",
          "val1": "20.52%",
          "val2": "17.91%",
          "chgp": "2.61%",
          "chgp_class": "positive"
        }
      ]
    }
  }
]

Quarterly Results Snapshot (Consolidated) - Jun'26 - QoQstock-summary

Jun'26
Mar'26
Change(%)
Net Sales
146.28
122.68
19.24%
Operating Profit (PBDIT) excl Other Income
26.01
20.63
26.08%
Interest
1.02
1.08
-5.56%
Exceptional Items
0.00
0.00
Consolidate Net Profit
17.12
13.15
30.19%
Operating Profit Margin (Excl OI)
17.78%
16.82%
0.96%
Values in Rs Cr.
Direction Arrows
Net Sales

QoQ Growth in quarter ended Jun 2026 is 19.24% vs 29.89% in Mar 2026

Direction Arrows
Consolidated Net Profit

QoQ Growth in quarter ended Jun 2026 is 30.19% vs 5.88% in Mar 2026

Half Yearly Results Snapshot (Consolidated) - Sep'25stock-summary

Sep'25
Sep'24
Change(%)
Net Sales
162.90
174.26
-6.52%
Operating Profit (PBDIT) excl Other Income
38.21
29.31
30.37%
Interest
2.57
0.86
198.84%
Exceptional Items
0.00
0.00
Consolidate Net Profit
23.26
18.77
23.92%
Operating Profit Margin (Excl OI)
23.46%
16.82%
6.64%
Values in Rs Cr.
Direction Arrows
Net Sales

Growth in half year ended Sep 2025 is -6.52% vs 9.04% in Sep 2024

Direction Arrows
Consolidated Net Profit

Growth in half year ended Sep 2025 is 23.92% vs 8.00% in Sep 2024

Nine Monthly Results Snapshot (Consolidated) - Dec'25stock-summary

Dec'25
Dec'24
Change(%)
Net Sales
257.35
272.78
-5.66%
Operating Profit (PBDIT) excl Other Income
57.37
48.40
18.53%
Interest
3.69
1.45
154.48%
Exceptional Items
0.00
0.00
Consolidate Net Profit
35.68
31.50
13.27%
Operating Profit Margin (Excl OI)
22.29%
17.74%
4.55%
Values in Rs Cr.
Direction Arrows
Net Sales

YoY Growth in nine months ended Dec 2025 is -5.66% vs 22.44% in Dec 2024

Direction Arrows
Consolidated Net Profit

YoY Growth in nine months ended Dec 2025 is 13.27% vs 21.29% in Dec 2024

Annual Results Snapshot (Consolidated) - Mar'26stock-summary

Mar'26
Mar'25
Change(%)
Net Sales
380.03
382.30
-0.59%
Operating Profit (PBDIT) excl Other Income
78.00
68.47
13.92%
Interest
4.77
2.48
92.34%
Exceptional Items
0.00
0.00
Consolidate Net Profit
48.96
43.40
12.81%
Operating Profit Margin (Excl OI)
20.52%
17.91%
2.61%
Values in Rs Cr.
Direction Arrows
Net Sales

YoY Growth in year ended Mar 2026 is -0.59% vs 28.30% in Mar 2025

Direction Arrows
Consolidated Net Profit

YoY Growth in year ended Mar 2026 is 12.81% vs 19.07% in Mar 2025

stock-summaryCompany CV
About Vidhi Specialty Food Ingredients Ltd stock-summary
stock-summary
Vidhi Specialty Food Ingredients Ltd
Micro Cap
Specialty Chemicals
Vidhi Specialty Food Ingredients Limited (Formerly known as Vidhi Dyestuffs Manufacturing Limited) was incorporated on 19th January, 1994. The Company is engaged in the business of manufacturing and trading in synthetic food colours and chemicals. It provides superior colour solutions in applications for various industries such as Food & Beverage, Confectionery, Pharmaceuticals, Feeds, Cosmetics, Dairy etc. Its manufacturing facilities are located in Raigad Dist. of Maharashtra.
Company Coordinates stock-summary
Company Details
E/27 Commerce Centre, 78 Tardeo Road Mumbai Maharashtra : 400034
stock-summary
Tel: 91-022-61406666
stock-summary
info@vidhifood.com
Registrar Details
Sharex Dynamic (India) Pvt Ltd , Unit -1, Luthra Ind. Premises , Safed Pool, Andheri-Kurla Road, Andheri (E), Mumbai