Eicher Motors

  • Market Cap: Large Cap
  • Industry: Automobiles
  • ISIN: INE066A01021
  • NSEID: EICHERMOT
  • BSEID: 505200
INR
7,351.00
369.5 (5.29%)
BSENSE

May 25

BSE+NSE Vol: 8.06 lacs

  • Price Points
  • Score
  • Mojo Parameters
  • Total Return
  • News and Corporate Actions
  • Key factors
  • Shareholding
  • Financials
  • CompanyCV
stock-summaryPrice Point
High/Low

1Day

52 Week

Valuation
Technical
Day's Volume

CASH

8.06 lacs (877.13%) Volume

Shareholding (Mar 2026)

FII

26.78%

Held by 1147 FIIs

DII

14.83%

Held by 51 DIIs

Promoter

49.06%

Who are the top shareholders of the Eicher Motors?

06-Jun-2025

The top shareholder of Eicher Motors is The Simran Siddhartha Tara Benefit Trust, holding 43.88% of shares, while promoters collectively own the majority with no pledged holdings. Institutional investors, including foreign institutional investors at 25.03% and mutual funds at 11.41%, along with individual investors at 7.36%, also contribute to the ownership structure.

The top shareholders of Eicher Motors include a mix of promoters, institutional investors, and individual shareholders. The largest shareholder is The Simran Siddhartha Tara Benefit Trust, which holds 43.88% of the shares. Promoters collectively hold the majority of the shares, with no pledged promoter holdings reported. <BR><BR>In terms of institutional investors, foreign institutional investors (FIIs) hold 25.03% of the company, while mutual funds are represented by 40 schemes that account for 11.41%. The highest public shareholder is the SBI Blue Chip Fund, which holds 3.8%. Individual investors collectively own 7.36% of the shares.

View full answer

how big is Eicher Motors?

06-Jun-2025

As of Jun 06, Eicher Motors Ltd has a market capitalization of 144,657.00 Cr, with recent net sales of 18,870.35 Cr and net profit of 4,734.44 Cr over the last four quarters. Shareholder's funds are 18,045.53 Cr, and total assets amount to 23,115.13 Cr as of Mar'24.

Market Cap: Eicher Motors Ltd has a market capitalization of 144,657.00 Cr and is classified as a Large Cap company as of Jun 06.<BR><BR>Recent Quarterly Performance: The sum of Net Sales for the latest 4 quarters is 18,870.35 Cr, while the sum of Net Profit for the same period is 4,734.44 Cr. This data is Consolidated.<BR><BR>Balance Sheet Snapshot: This is Consolidated data for the latest annual period ending in Mar'24. Shareholder's Funds are reported at 18,045.53 Cr, and Total Assets amount to 23,115.13 Cr.

View full answer

What does Eicher Motors do?

06-Jun-2025

Eicher Motors Limited is an Indian automotive company that manufactures and sells motorcycles and commercial vehicles. As of March 2025, it reported net sales of ₹5,241 Cr and a net profit of ₹1,362 Cr, with a market cap of ₹147,465 Cr.

Overview: <BR>Eicher Motors Limited (EML) is an Indian multinational automotive company engaged in the manufacturing and selling of motorcycles and commercial vehicles, operating within the large-cap automobiles industry.<BR><BR>History: <BR>Eicher Motors was incorporated in 1982 and has since established itself as a key player in the automotive sector. The latest quarterly results reported are for March 2025, showcasing the company's performance in net sales and profit.<BR><BR>Financial Snapshot: <BR>Most recent Net Sales: 5,241 Cr (Quarterly Results - Mar 2025) <BR>Most recent Net Profit: 1,362 Cr (Quarterly Results - Mar 2025) <BR>Market-cap value: Rs 147,465 Cr (Large Cap)<BR><BR>Key Metrics: <BR>P/E: 31.00 <BR>Industry P/E: 32 <BR>Dividend Yield: 0.96% <BR>Debt-Equity: -0.03 <BR>Return on Equity: 22.23% <BR>Price to Book: 6.83<BR><BR>Contact Details: <BR>Address: 3rd Floor - Select Citywalk, A - 3 District Centre Saket New Delhi New Delhi : 110017 <BR>Tel: 91-011-41437600 <BR>Email: investors@eicher.in/info@eicher.in <BR>Website: http://www.eicher.in

View full answer

Has Eicher Motors declared dividend?

06-Jun-2025

Yes, Eicher Motors has declared a dividend of 5100% (₹51 per share), with an ex-date of August 7, 2024. The company has shown strong total returns over various periods, including 213.56% over the last 5 years.

Eicher Motors Ltd has declared a dividend.<BR><BR>Dividend Details:<BR>- Percentage announced: 5100%<BR>- Amount per share: 51 per share<BR>- Ex-date: 07 Aug 24<BR><BR>Dividend Yield: 0.96%<BR><BR>Total Returns by Period:<BR>In the last 6 months, Eicher Motors has achieved a price return of 9.98%, with no dividend return, resulting in a total return of 9.98%. <BR><BR>Over the past year, the company recorded a price return of 13.78% and a dividend return of 1.07%, leading to a total return of 14.85%. <BR><BR>In the 2-year period, Eicher Motors experienced a price return of 44.89% and a dividend return of 2.52%, culminating in a total return of 47.41%. <BR><BR>For the 3-year period, the price return was 102.27% with a dividend return of 4.10%, resulting in a total return of 106.37%. <BR><BR>In the 4-year span, the company saw a price return of 95.78% and a dividend return of 4.60%, achieving a total return of 100.38%. <BR><BR>Finally, over the last 5 years, Eicher Motors delivered a remarkable price return of 206.69% alongside a dividend return of 6.87%, leading to an impressive total return of 213.56%. <BR><BR>Overall, Eicher Motors has declared a substantial dividend, and the total returns over various periods indicate strong performance, particularly in terms of price appreciation.

View full answer

Who are the peers of the Eicher Motors?

03-Jun-2025

Eicher Motors' peers include Maruti Suzuki, M & M, Tata Motors, Bajaj Auto, Hyundai Motor I, TVS Motor Co., Hero MotoCorp, Ashok Leyland, and Escorts Kubota. In terms of returns, Eicher Motors has a 1-year return of 14.07%, higher than Tata Motors (-25.62%) but lower than M & M (15.74%).

Peers: The peers of Eicher Motors are Maruti Suzuki, M & M, Tata Motors, Bajaj Auto, Hyundai Motor I, TVS Motor Co., Hero MotoCorp, Ashok Leyland, and Escorts Kubota.<BR><BR>Quality Snapshot: Excellent management risk is observed at Bajaj Auto and Hyundai Motor I, while Good management risk is found at Maruti Suzuki, M & M, Tata Motors, TVS Motor Co., Hero MotoCorp, Ashok Leyland, and Escorts Kubota, and the rest. Excellent growth is noted at Bajaj Auto, Hyundai Motor I, and TVS Motor Co., while Good growth is seen at Eicher Motors, Maruti Suzuki, M & M, Tata Motors, and the rest. Capital Structure is Excellent for Bajaj Auto, Hyundai Motor I, Eicher Motors, and Escorts Kubota, while Below Average is found at M & M, TVS Motor Co., and Ashok Leyland, and the rest.<BR><BR>Return Snapshot: The peer with the highest 1-year return is M & M at 15.74%, while Tata Motors has the lowest at -25.62%. Eicher Motors has a 1-year return of 14.07%, which is significantly higher than Tata Motors but lower than M & M. Additionally, Tata Motors, Bajaj Auto, Hyundai Motor I, Hero MotoCorp, Escorts Kubota, and Ola Electric have negative six-month returns.

View full answer

Who are in the management team of Eicher Motors?

16-Jul-2025

As of March 2023, the management team of Eicher Motors includes S Sandilya (Chairman), Siddhartha Lal (Managing Director), Govindarajan Balakrishnan (CEO), and several independent and non-executive directors. They oversee the company's operations and strategic direction.

As of March 2023, the management team of Eicher Motors includes the following individuals:<BR><BR>1. S Sandilya - Chairman & Independent Director<BR>2. Siddhartha Lal - Managing Director<BR>3. Govindarajan Balakrishnan - Whole Time Director & CEO<BR>4. Vinod K. Aggarwal - Non-Executive & Non-Independent Director<BR>5. Manvi Sinha - Independent Non-Executive Director<BR>6. Inder Mohan Singh - Independent Non-Executive Director<BR>7. Atul Sharma - Company Secretary & Compliance Officer<BR><BR>This team is responsible for overseeing the operations and strategic direction of the company.

View full answer

Is Eicher Motors overvalued or undervalued?

23-Jul-2025

As of July 22, 2025, Eicher Motors is considered overvalued with a PE ratio of 31.52 and an EV to EBITDA of 31.54, trading at a premium compared to peers like Bajaj Auto and Hero MotoCorp, despite a strong year-to-date return of 12.78%.

As of 22 July 2025, Eicher Motors has moved from a valuation grade of very expensive to expensive. The company is currently considered overvalued. Key ratios include a PE ratio of 31.52, an EV to EBITDA of 31.54, and a ROE of 22.23%. <BR><BR>In comparison to its peers, Bajaj Auto has a PE ratio of 31.62 and an EV to EBITDA of 22.18, while Hero MotoCorp stands out with a PE of 19.83 and an EV to EBITDA of 13.51, indicating that Eicher Motors is trading at a premium relative to these competitors. Despite a strong year-to-date return of 12.78% compared to the Sensex's 5.18%, the valuation metrics suggest that the stock is not justified at its current price level.

View full answer

How has been the historical performance of Eicher Motors?

13-Nov-2025

Eicher Motors has shown consistent growth in net sales and profitability, with net sales increasing from ₹9,797.06 crore in March 2019 to ₹18,870.35 crore in March 2025, and profit after tax rising from ₹1,961.85 crore to ₹4,034.63 crore in the same period. The company's earnings per share also improved significantly from ₹80.75 to ₹172.66.

Answer:<BR>The historical performance of Eicher Motors shows a consistent growth trajectory in net sales and profitability over the years.<BR><BR>Breakdown:<BR>Eicher Motors has demonstrated significant growth in net sales, increasing from 9,797.06 crore in March 2019 to 18,870.35 crore in March 2025. This upward trend is reflected in the total operating income, which rose from 9,797.06 crore in March 2019 to 18,870.35 crore in March 2025. The company's operating profit (PBDIT) also improved markedly, climbing from 3,346.50 crore in March 2019 to 6,016.93 crore in March 2025. Profit before tax followed a similar pattern, increasing from 3,038.89 crore in March 2019 to 5,233.26 crore in March 2025, while profit after tax reached 4,034.63 crore in March 2025, up from 1,961.85 crore in March 2019. The earnings per share (EPS) rose significantly from 80.75 in March 2019 to 172.66 in March 2025, indicating enhanced shareholder value. On the balance sheet, total assets grew from 27,174.41 crore in March 2025, compared to 12,449.72 crore in March 2020, while total liabilities increased from 12,449.72 crore in March 2020 to 27,174.41 crore in March 2025. Cash flow from operating activities also improved, reaching 3,979 crore in March 2025, up from 1,694 crore in March 2020, showcasing the company's strong operational performance.

View full answer

Is Eicher Motors technically bullish or bearish?

03-Dec-2025

As of December 2, 2025, the technical trend is bullish with daily indicators supporting this stance, though mixed signals from weekly indicators suggest caution.

As of 2 December 2025, the technical trend has changed from mildly bullish to bullish. The current technical stance is bullish, with strength indicated by the daily moving averages and the bullish signals from the Bollinger Bands and OBV. However, the weekly MACD and KST are mildly bearish, and the weekly RSI shows no signal, suggesting some mixed signals in the shorter time frame. The monthly indicators remain bullish overall, but the lack of a clear trend in Dow Theory indicates caution.

View full answer

When is the next results date for Eicher Motors Ltd?

15-May-2026

The next results date for Eicher Motors Ltd is 22 May 2026.

The next results date for Eicher Motors Ltd is scheduled for 22 May 2026.

View full answer

Are Eicher Motors Ltd latest results good or bad?

23-May-2026

Eicher Motors Ltd's latest Q4 FY26 results show strong profitability with a net profit increase of 6.99% quarter-on-quarter, but a slight net sales decline of 0.56% raises concerns. While the company maintains a solid return on equity and a strong stock performance over the past year, recent revenue and margin pressures suggest investors should remain cautious.

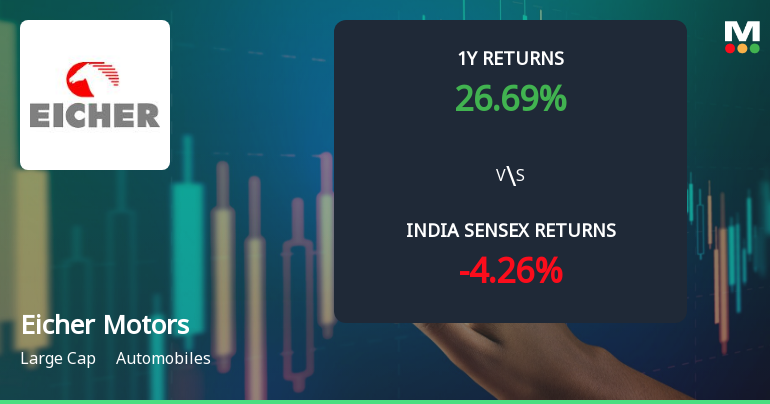
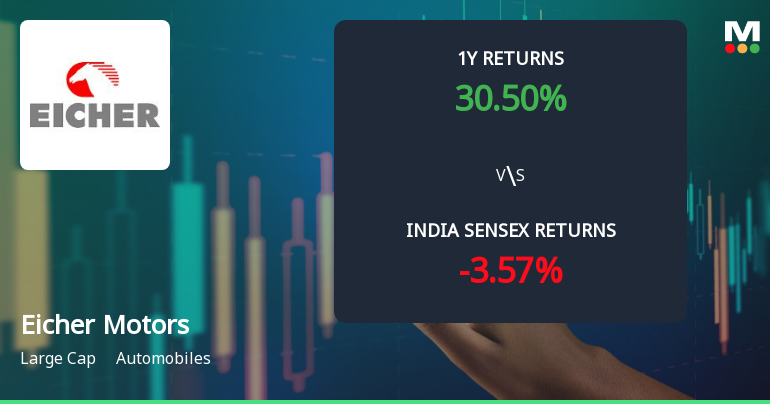
Eicher Motors Ltd's latest results for Q4 FY26 present a mixed picture. On the positive side, the consolidated net profit reached ₹1,519.95 crore, reflecting a healthy increase of 6.99% quarter-on-quarter and 11.58% year-on-year. This indicates strong profitability and effective cost management.<BR><BR>However, net sales showed a slight decline of 0.56% compared to the previous quarter, although they did grow by 16.01% year-on-year. This sequential dip in revenue is concerning, especially following two quarters of strong growth. The operating margin also saw a decrease of 56 basis points from the previous quarter, which suggests some operational challenges.<BR><BR>Despite these headwinds, Eicher Motors maintains a robust return on equity of 23.12%, indicating strong capital efficiency. The company has a solid balance sheet, being virtually debt-free, which provides it with financial flexibility.<BR><BR>In terms of stock performance, Eicher Motors has delivered a remarkable 29.04% return over the past year, significantly outperforming the broader market. However, recent three-month performance has shown a decline of 12.01%, indicating some near-term challenges.<BR><BR>Overall, while Eicher Motors has demonstrated strong fundamentals and profitability, the recent revenue decline and margin pressures suggest that investors should remain cautious and monitor future performance closely.

View full answer

Should I buy, sell or hold Eicher Motors Ltd?

23-May-2026

Why is Eicher Motors Ltd falling/rising?

24-May-2026

As of 24-May, Eicher Motors Ltd's stock price has risen to Rs 6,983.70, reflecting a 1.22% increase due to strong investor interest, significant delivery volume growth, and solid long-term fundamentals, including a net-debt-free status and high institutional holdings. The stock has outperformed its sector and generated a 29.04% return over the past year, indicating robust market confidence.

As of 24-May, Eicher Motors Ltd is experiencing a rise in its stock price, currently at Rs 6,983.70, reflecting an increase of Rs 84.05 or 1.22%. This upward movement can be attributed to several positive factors. The stock has outperformed its sector by 1.15% today and has shown consecutive gains over the last two days, accumulating a total return of 1.94% during this period. Additionally, the stock reached an intraday high of Rs 7,039.5, indicating strong investor interest.<BR><BR>Investor participation has also increased significantly, with delivery volume rising by 131.1% against the five-day average, suggesting heightened demand for the stock. The liquidity of the stock is favorable, with a trading value that supports substantial trade sizes.<BR><BR>From a fundamental perspective, Eicher Motors Ltd demonstrates strong long-term growth potential, evidenced by a robust average Return on Equity (ROE) of 20.03% and impressive annual growth rates in net sales and operating profit. The company has maintained a net-debt-free status and has reported positive results for the last three consecutive quarters, further enhancing investor confidence.<BR><BR>Moreover, the stock has shown a remarkable performance relative to the broader market, generating a 29.04% return over the past year, while the BSE500 index has seen negative returns. High institutional holdings at 41.6% indicate that knowledgeable investors are backing the stock, which can contribute to its stability and growth.<BR><BR>Overall, the combination of strong performance metrics, increased investor participation, and positive market sentiment are key factors driving the rise in Eicher Motors Ltd's stock price.

View full answer
iScoreScore
Click here to find our call on this stock
Strong Sell
Sell
Hold
Buy
Strong Buy

Dashboard

1

Strong Long Term Fundamental Strength with an average Return on Equity (ROE) of 20.03%

  • Healthy long term growth as Net Sales has grown by an annual rate of 23.09% and Operating profit at 32.76%
  • The company is Net-Debt Free
2

The company has declared Positive results for the last 3 consecutive quarters

3

High Institutional Holdings at 41.6%

4

Market Beating Performance

5

With its market cap of Rs 1,91,691 cr, it is the second biggest company in the sector (behind Bajaj Auto)and constitutes 23.92% of the entire sector

stock-summaryMojo Parameters

Mojo Parameters

Loading Valuation Snapshot...

Stock DNA

stock-summary
Industry

Automobiles

stock-summary
Market cap

INR 201,648 Cr (Large Cap)

stock-summary
P/E

35.00

stock-summary
Industry P/E

30

stock-summary
Dividend Yield

1.00%

stock-summary
Debt Equity

-0.12

stock-summary
Return on Equity

23.12%

stock-summary
Price to Book

8.68

Revenue and Profits:
Net Sales:
6,080 Cr
(Quarterly Results - Mar 2026)
Net Profit:
1,520 Cr
stock-summaryTotal Returns
Total Returns (Price + Dividend) stock-summary
Dividend Yield (1%)
TimePeriod
Price Return
Dividend Return
Total Return
3 Months
-8.2%
0%
-8.2%
6 Months
1.84%
0%
1.84%
1 Year
36.13%
1.31%
37.44%
2 Years
50.61%
2.69%
53.3%
3 Years
101.31%
4.40%
105.71%
4 Years
173.66%
6.58%
180.24%
5 Years
180.03%
7.26%
187.29%

Latest dividend: 70 per share ex-dividend date: Aug-01-2025

Risk Adjusted Returns v/s stock-summary
Returns Beta
Icon
Beta has not been calculated since enough price history is not available
stock-summaryNews & Corporate Actions

News

Announcements stock-summary

Eicher Motors Limited - Analysts/Institutional Investor Meet/Con. Call Updates

03-Dec-2019 | Source : NSE

Eicher Motors Limited has informed the Exchange regarding Analysts/Institutional Investor Meet/Con. Call Updates

Eicher Motors Limited - Analysts/Institutional Investor Meet/Con. Call Updates

28-Nov-2019 | Source : NSE

Eicher Motors Limited has informed the Exchange regarding Analysts/Institutional Investor Meet/Con. Call Updates

Eicher Motors Limited - Updates

27-Nov-2019 | Source : NSE

Eicher Motors Limited has informed the Exchange regarding 'Sustainability Report of Eicher Motors Limited for the Financial Year 2018-19'.

Corporate Actions stock-summary

stock-summary
BOARD MEETING

No Upcoming Board Meetings

stock-summary
DIVIDEND

Eicher Motors Ltd has declared 7000% dividend, ex-date: 01 Aug 25

stock-summary
SPLITS

Eicher Motors Ltd has announced 1:10 stock split, ex-date: 24 Aug 20

stock-summary
BONUS

No Bonus history available

stock-summary
RIGHTS

No Rights history available

stock-summaryKey Factors

Quality key factors stock-summary

Factor
Value
Sales Growth (5y)
23.09%
EBIT Growth (5y)
32.76%
EBIT to Interest (avg)
85.09
Debt to EBITDA (avg)
Net Debt is too low
Net Debt to Equity (avg)
-0.12
Sales to Capital Employed (avg)
0.89
Tax Ratio
21.61%
Dividend Payout Ratio
34.90%
Pledged Shares
0
Institutional Holding
41.60%
ROCE (avg)
21.84%
ROE (avg)
20.03%

Valuation key factors

Factor
Value
P/E Ratio
35
Industry P/E
30
Price to Book Value
8.68
EV to EBIT
40.06
EV to EBITDA
34.19
EV to Capital Employed
9.72
EV to Sales
8.38
PEG Ratio
1.65
Dividend Yield
1.00%
ROCE (Latest)
22.61%
ROE (Latest)
23.12%

Technicals key factors

Indicator
Weekly
Monthly
MACD
Mildly Bearish
Mildly Bearish
RSI
No Signal
No Signal
Bollinger Bands
Bearish
Mildly Bullish
Moving Averages
Mildly Bullish (Daily)
KST
Bearish
Bullish
Dow Theory
Mildly Bearish
Mildly Bearish
OBV
Mildly Bearish
Bullish
stock-summary Technical Indicator Scale: Bearish, Mildly Bearish, Sideways, Mildly Bullish, Bullish  Turned 
stock-summaryShareholding
Shareholding Snapshot : Mar 2026stock-summary
Shareholding Compare (%holding) stock-summary
Majority shareholders

Promoters

Pledged Promoter Holdings

None

Mutual Funds

Held by 42 Schemes (10.16%)

FIIs

Held by 1147 FIIs (26.78%)

Promoter with highest holding

The Simran Siddhartha Tara Benefit Trust (name Of Trustees Are Mentioned In Note-4) (43.86%)

Highest Public shareholder

Hdfc Trustee Company Limited-hdfc Flexi Cap Fund (2.79%)

Individual Investors Holdings

7.48%

stock-summaryFinancial
[
  {
    "link": "quarterly",
    "btn_text": "All Quarterly Results",
    "header": "Quarterly Results Snapshot (Consolidated) - Mar'26 - QoQ",
    "rhs": [
      {
        "prefix": "Net Sales ",
        "suffix": "QoQ Growth in quarter ended Mar 2026 is -0.56% vs -0.93% in Dec 2025",
        "dir": 1
      },
      {
        "prefix": "Consolidated Net Profit ",
        "suffix": "QoQ Growth in quarter ended Mar 2026 is 6.99% vs 3.74% in Dec 2025",
        "dir": 1
      }
    ],
    "table": {
      "header": [
        "Mar'26",
        "Dec'25",
        "Change(%)"
      ],
      "body": [
        {
          "field": "Net Sales",
          "val1": "6,080.09",
          "val2": "6,114.04",
          "chgp": "-0.56%",
          "chgp_class": "negative"
        },
        {
          "field": "Operating Profit (PBDIT) excl Other Income",
          "val1": "1,513.67",
          "val2": "1,556.72",
          "chgp": "-2.77%",
          "chgp_class": "negative"
        },
        {
          "field": "Interest",
          "val1": "20.20",
          "val2": "17.27",
          "chgp": "16.97%",
          "chgp_class": "negative"
        },
        {
          "field": "Exceptional Items",
          "val1": "0.00",
          "val2": "-55.45",
          "chgp": "100.00%",
          "chgp_class": "positive"
        },
        {
          "field": "Consolidate Net Profit",
          "val1": "1,519.95",
          "val2": "1,420.61",
          "chgp": "6.99%",
          "chgp_class": "positive"
        },
        {
          "field": "Operating Profit Margin (Excl OI)",
          "val1": "25.39%",
          "val2": "25.95%",
          "chgp": "-0.56%",
          "chgp_class": "negative"
        }
      ]
    }
  },
  {
    "link": "half-yearly",
    "btn_text": "All Half Yearly Results",
    "header": "Half Yearly Results Snapshot (Consolidated) - Sep'25",
    "rhs": [
      {
        "prefix": "Net Sales ",
        "suffix": " Growth in half year ended Sep 2025 is 29.54% vs 6.85% in Sep 2024",
        "dir": 1
      },
      {
        "prefix": "Consolidated Net Profit ",
        "suffix": " Growth in half year ended Sep 2025 is 16.94% vs 13.81% in Sep 2024",
        "dir": 1
      }
    ],
    "table": {
      "header": [
        "Sep'25",
        "Sep'24",
        "Change(%)"
      ],
      "body": [
        {
          "field": "Net Sales",
          "val1": "11,213.43",
          "val2": "8,656.12",
          "chgp": "29.54%",
          "chgp_class": "positive"
        },
        {
          "field": "Operating Profit (PBDIT) excl Other Income",
          "val1": "2,714.68",
          "val2": "2,253.15",
          "chgp": "20.48%",
          "chgp_class": "positive"
        },
        {
          "field": "Interest",
          "val1": "34.06",
          "val2": "25.41",
          "chgp": "34.04%",
          "chgp_class": "negative"
        },
        {
          "field": "Exceptional Items",
          "val1": "0.00",
          "val2": "0.00",
          "chgp": "",
          "chgp_class": "neutral"
        },
        {
          "field": "Consolidate Net Profit",
          "val1": "2,574.67",
          "val2": "2,201.79",
          "chgp": "16.94%",
          "chgp_class": "positive"
        },
        {
          "field": "Operating Profit Margin (Excl OI)",
          "val1": "24.64%",
          "val2": "26.51%",
          "chgp": "-1.87%",
          "chgp_class": "negative"
        }
      ]
    }
  },
  {
    "link": "nine-monthly",
    "btn_text": "All Nine Monthly Results",
    "header": "Nine Monthly Results Snapshot (Consolidated) - Dec'25",
    "rhs": [
      {
        "prefix": "Net Sales ",
        "suffix": "YoY Growth in nine months ended Dec 2025 is 27.13% vs 10.99% in Dec 2024",
        "dir": 1
      },
      {
        "prefix": "Consolidated Net Profit ",
        "suffix": "YoY Growth in nine months ended Dec 2025 is 18.47% vs 15.07% in Dec 2024",
        "dir": 1
      }
    ],
    "table": {
      "header": [
        "Dec'25",
        "Dec'24",
        "Change(%)"
      ],
      "body": [
        {
          "field": "Net Sales",
          "val1": "17,327.47",
          "val2": "13,629.24",
          "chgp": "27.13%",
          "chgp_class": "positive"
        },
        {
          "field": "Operating Profit (PBDIT) excl Other Income",
          "val1": "4,271.40",
          "val2": "3,454.34",
          "chgp": "23.65%",
          "chgp_class": "positive"
        },
        {
          "field": "Interest",
          "val1": "51.33",
          "val2": "38.80",
          "chgp": "32.29%",
          "chgp_class": "negative"
        },
        {
          "field": "Exceptional Items",
          "val1": "-55.45",
          "val2": "0.00",
          "chgp": "",
          "chgp_class": "neutral"
        },
        {
          "field": "Consolidate Net Profit",
          "val1": "3,995.28",
          "val2": "3,372.29",
          "chgp": "18.47%",
          "chgp_class": "positive"
        },
        {
          "field": "Operating Profit Margin (Excl OI)",
          "val1": "24.65%",
          "val2": "25.35%",
          "chgp": "-0.70%",
          "chgp_class": "negative"
        }
      ]
    }
  },
  {
    "link": "annual",
    "btn_text": "All Annual Results",
    "header": "Annual Results Snapshot (Consolidated) - Mar'26",
    "rhs": [
      {
        "prefix": "Net Sales ",
        "suffix": "YoY Growth in year ended Mar 2026 is 24.04% vs 14.12% in Mar 2025",
        "dir": 1
      },
      {
        "prefix": "Consolidated Net Profit ",
        "suffix": "YoY Growth in year ended Mar 2026 is 16.49% vs 18.33% in Mar 2025",
        "dir": -1
      }
    ],
    "table": {
      "header": [
        "Mar'26",
        "Mar'25",
        "Change(%)"
      ],
      "body": [
        {
          "field": "Net Sales",
          "val1": "23,407.56",
          "val2": "18,870.35",
          "chgp": "24.04%",
          "chgp_class": "positive"
        },
        {
          "field": "Operating Profit (PBDIT) excl Other Income",
          "val1": "5,785.07",
          "val2": "4,712.03",
          "chgp": "22.77%",
          "chgp_class": "positive"
        },
        {
          "field": "Interest",
          "val1": "71.53",
          "val2": "54.34",
          "chgp": "31.63%",
          "chgp_class": "negative"
        },
        {
          "field": "Exceptional Items",
          "val1": "-55.45",
          "val2": "0.00",
          "chgp": "",
          "chgp_class": "neutral"
        },
        {
          "field": "Consolidate Net Profit",
          "val1": "5,515.23",
          "val2": "4,734.44",
          "chgp": "16.49%",
          "chgp_class": "positive"
        },
        {
          "field": "Operating Profit Margin (Excl OI)",
          "val1": "25.18%",
          "val2": "25.42%",
          "chgp": "-0.24%",
          "chgp_class": "negative"
        }
      ]
    }
  }
]

Quarterly Results Snapshot (Consolidated) - Mar'26 - QoQstock-summary

Mar'26
Dec'25
Change(%)
Net Sales
6,080.09
6,114.04
-0.56%
Operating Profit (PBDIT) excl Other Income
1,513.67
1,556.72
-2.77%
Interest
20.20
17.27
16.97%
Exceptional Items
0.00
-55.45
100.00%
Consolidate Net Profit
1,519.95
1,420.61
6.99%
Operating Profit Margin (Excl OI)
25.39%
25.95%
-0.56%
Values in Rs Cr.
Direction Arrows
Net Sales

QoQ Growth in quarter ended Mar 2026 is -0.56% vs -0.93% in Dec 2025

Direction Arrows
Consolidated Net Profit

QoQ Growth in quarter ended Mar 2026 is 6.99% vs 3.74% in Dec 2025

Half Yearly Results Snapshot (Consolidated) - Sep'25stock-summary

Sep'25
Sep'24
Change(%)
Net Sales
11,213.43
8,656.12
29.54%
Operating Profit (PBDIT) excl Other Income
2,714.68
2,253.15
20.48%
Interest
34.06
25.41
34.04%
Exceptional Items
0.00
0.00
Consolidate Net Profit
2,574.67
2,201.79
16.94%
Operating Profit Margin (Excl OI)
24.64%
26.51%
-1.87%
Values in Rs Cr.
Direction Arrows
Net Sales

Growth in half year ended Sep 2025 is 29.54% vs 6.85% in Sep 2024

Direction Arrows
Consolidated Net Profit

Growth in half year ended Sep 2025 is 16.94% vs 13.81% in Sep 2024

Nine Monthly Results Snapshot (Consolidated) - Dec'25stock-summary

Dec'25
Dec'24
Change(%)
Net Sales
17,327.47
13,629.24
27.13%
Operating Profit (PBDIT) excl Other Income
4,271.40
3,454.34
23.65%
Interest
51.33
38.80
32.29%
Exceptional Items
-55.45
0.00
Consolidate Net Profit
3,995.28
3,372.29
18.47%
Operating Profit Margin (Excl OI)
24.65%
25.35%
-0.70%
Values in Rs Cr.
Direction Arrows
Net Sales

YoY Growth in nine months ended Dec 2025 is 27.13% vs 10.99% in Dec 2024

Direction Arrows
Consolidated Net Profit

YoY Growth in nine months ended Dec 2025 is 18.47% vs 15.07% in Dec 2024

Annual Results Snapshot (Consolidated) - Mar'26stock-summary

Mar'26
Mar'25
Change(%)
Net Sales
23,407.56
18,870.35
24.04%
Operating Profit (PBDIT) excl Other Income
5,785.07
4,712.03
22.77%
Interest
71.53
54.34
31.63%
Exceptional Items
-55.45
0.00
Consolidate Net Profit
5,515.23
4,734.44
16.49%
Operating Profit Margin (Excl OI)
25.18%
25.42%
-0.24%
Values in Rs Cr.
Direction Arrows
Net Sales

YoY Growth in year ended Mar 2026 is 24.04% vs 14.12% in Mar 2025

Direction Arrows
Consolidated Net Profit

YoY Growth in year ended Mar 2026 is 16.49% vs 18.33% in Mar 2025

stock-summaryCompany CV
About Eicher Motors Ltd stock-summary
stock-summary
Eicher Motors Ltd
Large Cap
Automobiles
Eicher Motors Limited (EML) is an Indian, multinational automotive company that has diversified interests in motorcycle and commercial vehicles manufacturing. The Company is engaged in the manufacturing and selling of motorcycles, spare parts and related services. It manufactures the iconic 'Royal Enfield' brand of motorcycles, which leads the premium motorcycle segment in India. Royal Enfield is the oldest motorcycle brand in continuous production world-wide since 1901.
Company Coordinates stock-summary
Company Details
3rd Floor - Select Citywalk, A - 3 District Centre Saket New Delhi New Delhi : 110017
stock-summary
Tel: 91-011-41437600
stock-summary
investors@eicher.in/info@eicher.in
Registrar Details
MCS Ltd , F-65, , Okhla Industrial Area, Phase - I, New Delhi