
Compare Mahamaya Steel with Similar Stocks
Dashboard
Weak Long Term Fundamental Strength with an average Return on Capital Employed (ROCE) of 5.57%
- Poor long term growth as Operating profit has grown by an annual rate 15.89% of over the last 5 years
The company has declared Positive results for the last 5 consecutive quarters
With ROCE of 6.8, it has a Very Expensive valuation with a 7.2 Enterprise value to Capital Employed
Despite the size of the company, domestic mutual funds hold only 0% of the company
Stock DNA
Iron & Steel Products
INR 1,551 Cr (Micro Cap)
164.00
59
0.00%
0.36
5.73%
9.41
Total Returns (Price + Dividend) 
Mahamaya Steel for the last several years.
Risk Adjusted Returns v/s
Returns Beta

News

Mahamaya Steel Industries Ltd Upgraded to Hold on Technical Improvements and Valuation Concerns
Mahamaya Steel Industries Ltd has seen its investment rating upgraded from Sell to Hold, driven primarily by a marked improvement in technical indicators, even as valuation metrics have become more stretched. The company’s financial trend remains positive with consistent quarterly growth, but valuation concerns and moderate quality scores temper enthusiasm, resulting in a balanced outlook for investors.
Read full news article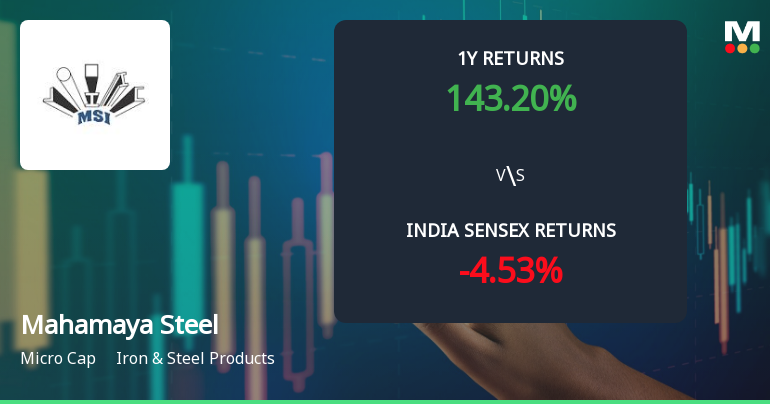
Mahamaya Steel Industries Ltd Sees Bullish Momentum Shift Amid Technical Upgrades
Mahamaya Steel Industries Ltd has witnessed a significant shift in its technical momentum, moving from a mildly bullish stance to a more confident bullish trend. This change is underscored by a notable 9.42% surge in the stock price on 30 Jul 2026, reflecting renewed investor interest and positive technical signals across multiple timeframes.
Read full news article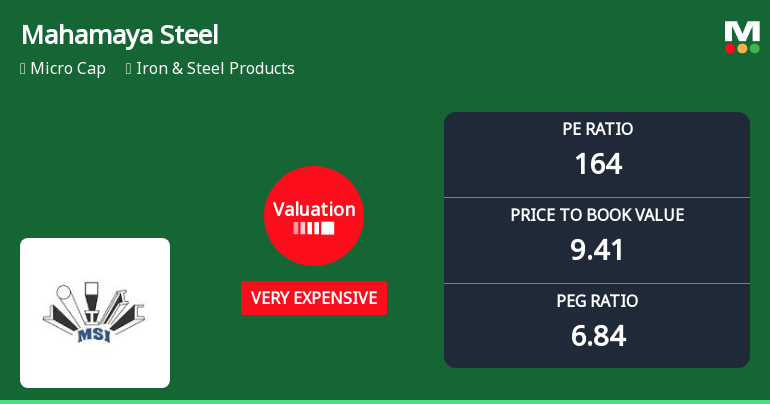
Mahamaya Steel Industries Ltd Valuation Shifts Amidst Strong Market Performance
Mahamaya Steel Industries Ltd has witnessed a significant re-rating in its valuation parameters, moving from an expensive to a very expensive classification. Despite a robust share price rally of 9.42% on 30 Jul 2026, the company’s price-to-earnings (P/E) and price-to-book value (P/BV) ratios have surged well above industry averages, prompting a reassessment of its price attractiveness within the iron and steel products sector.
Read full news article Announcements
Mahamaya Steel Industries Limited - Updates
13-Nov-2019 | Source : NSEMahamaya Steel Industries Limited has informed the Exchange regarding 'Publication Of Unaudited Financial Results for the quarter & half year ended 30th September, 2019.'.
Mahamaya Steel Industries Limited - Updates
05-Nov-2019 | Source : NSEMahamaya Steel Industries Limited has informed the Exchange regarding 'Publication of Notice of Board Meeting to be held on 12.11.2019.'.
Mahamaya Steel Industries Limited - Updates
04-Nov-2019 | Source : NSEMahamaya Steel Industries Limited has informed the Exchange regarding 'Intimation regarding transfer of shares as per clause 2C(iii)(5) of SEBI Circular No. SEBI/HO/MIRSD/DOSS3/CIR/P/2018/139, dated 06.11.2018 as per standardized norms for transfer of securities in physical mode.'.
Corporate Actions

No Upcoming Board Meetings

Mahamaya Steel Industries Ltd has declared 5% dividend, ex-date: 08 Sep 10

No Splits history available

No Bonus history available

No Rights history available
Quality key factors
Valuation key factors
Technicals key factors
 Technical Indicator Scale: Bearish, Mildly Bearish, Sideways, Mildly Bullish, Bullish Turned
 Shareholding Snapshot : Jun 2026
Shareholding Compare (%holding)
Promoters
None
Held by 0 Schemes
Held by 1 FIIs (0.0%)
Escort Finvest Private Limited (24.95%)
Vijay Rathee (4.96%)
24.24%
Quarterly Results Snapshot (Consolidated) - Mar'26 - QoQ

QoQ Growth in quarter ended Mar 2026 is 17.41% vs 18.85% in Dec 2025

QoQ Growth in quarter ended Mar 2026 is 113.09% vs 1.60% in Dec 2025
Half Yearly Results Snapshot (Consolidated) - Sep'25
Growth in half year ended Sep 2025 is 8.16% vs -9.90% in Sep 2024
Growth in half year ended Sep 2025 is 229.09% vs -65.73% in Sep 2024
Nine Monthly Results Snapshot (Consolidated) - Dec'25
YoY Growth in nine months ended Dec 2025 is 9.57% vs -3.52% in Dec 2024
YoY Growth in nine months ended Dec 2025 is 152.51% vs -58.60% in Dec 2024
Annual Results Snapshot (Consolidated) - Mar'26
YoY Growth in year ended Mar 2026 is 10.11% vs 2.29% in Mar 2025
YoY Growth in year ended Mar 2026 is 26.32% vs 13.10% in Mar 2025
About Mahamaya Steel Industries Ltd

Company Coordinates


