
 Price Point
Compare Manaksia Coated with Similar Stocks
ScoreDashboard
Low ability to service debt as the company has a high Debt to EBITDA ratio of 1.43 times
- Low ability to service debt as the company has a high Debt to EBITDA ratio of 1.43 times
- The company has been able to generate a Return on Equity (avg) of 7.58% signifying low profitability per unit of shareholders funds
Poor long term growth as Net Sales has grown by an annual rate of 10.81% over the last 5 years
Positive results in Jun 26
With ROCE of 16.5, it has a Attractive valuation with a 3.2 Enterprise value to Capital Employed
Falling Participation by Institutional Investors
Mojo ParametersStock DNA

Iron & Steel Products

INR 1,310 Cr (Micro Cap)

32.00
35

0.08%

0.23

11.66%

3.73
Total ReturnsTotal Returns (Price + Dividend) 
Latest dividend: 0.04920473083197391 per share ex-dividend date: Aug-27-2026
Risk Adjusted Returns v/s
Returns Beta
 News & Corporate Actions
News
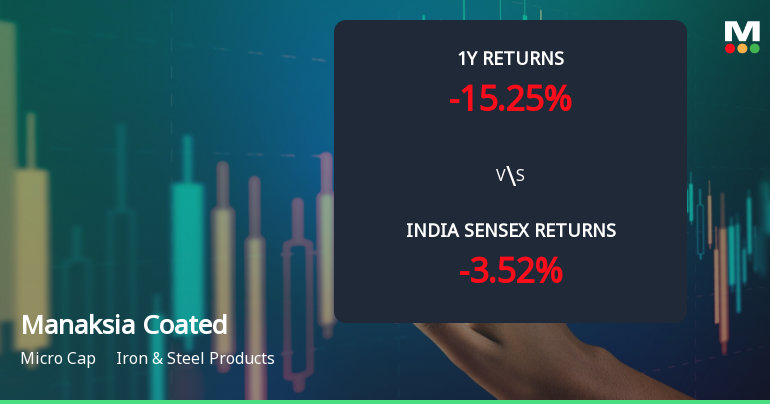
Manaksia Coated Metals & Industries Ltd Shows Mildly Bullish Technical Momentum Amid Market Volatility
Manaksia Coated Metals & Industries Ltd has exhibited a notable shift in its technical momentum, moving from a sideways trend to a mildly bullish stance. This change is underscored by a combination of technical indicators, including MACD, RSI, moving averages, and Bollinger Bands, signalling a cautiously optimistic outlook for the iron and steel products company amid a micro-cap market environment.
Read full news article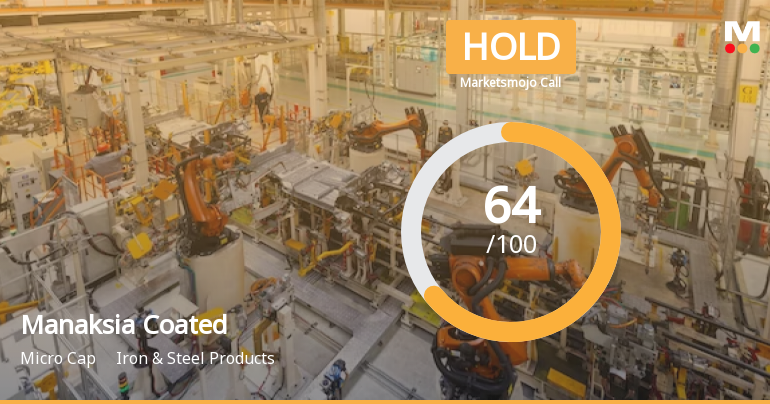
Manaksia Coated Metals & Industries Ltd is Rated Hold
Manaksia Coated Metals & Industries Ltd is rated 'Hold' by MarketsMOJO, with this rating last updated on 17 August 2026. However, the analysis and financial metrics presented here reflect the company’s current position as of 29 August 2026, providing investors with the most recent insights into its performance and outlook.
Read full news article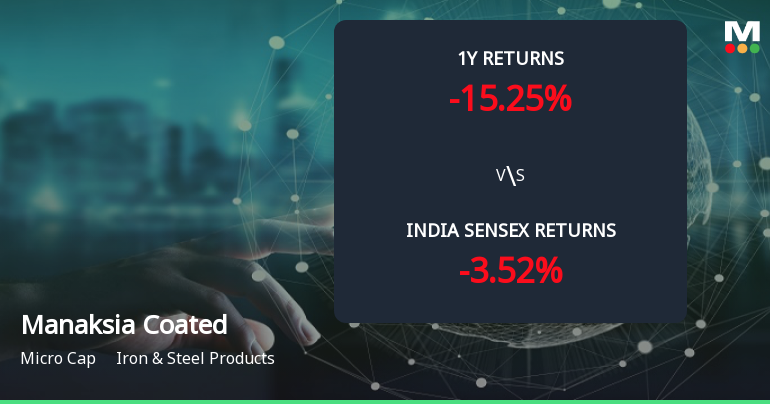
Golden Cross Confirmed: Do Manaksia Coated Metals & Industries Ltd's Other Technical Indicators Agree?
The 50-day moving average has crossed above the 200-day moving average for Manaksia Coated Metals & Industries Ltd, signalling a golden cross on 28 Aug 2026. Yet, the broader technical and fundamental picture presents a nuanced view that tempers the enthusiasm this crossover might typically inspire.
Read full news article Announcements
Manaksia Coated Metals & Industries Limited - Other General Purpose
05-Dec-2019 | Source : NSEManaksia Coated Metals & Industries Limited has informed the Exchange regarding Compliance under Regulation 23(9) of SEBI Listing Regulations of Related Party transactions for the half year ended September 30, 2019.
Manaksia Coated Metals & Industries Limited - Shareholders meeting
26-Sep-2019 | Source : NSEManaksia Coated Metals & Industries Limited has submitted the Exchange a copy Srutinizers report of Annual General Meeting held on September 24, 2019. Further, the company has informed the Exchange regarding voting results.
Manaksia Coated Metals & Industries Limited - Shareholders meeting
25-Sep-2019 | Source : NSEManaksia Coated Metals & Industries Limited has informed the Exchange regarding Proceedings of Annual General Meeting held on September 24, 2019
Corporate Actions

No Upcoming Board Meetings

Manaksia Coated Metals & Industries Ltd has declared 5% dividend, ex-date: 27 Aug 26

No Splits history available

No Bonus history available

No Rights history available
Key FactorsQuality key factors
Valuation key factors
Technicals key factors
 Technical Indicator Scale: Bearish, Mildly Bearish, Sideways, Mildly Bullish, Bullish Turned Shareholding
Shareholding Snapshot : Jun 2026
Shareholding Compare (%holding)
Promoters
None
Held by 0 Schemes
Held by 4 FIIs (0.22%)
Sushil Kumar Agrawal (31.99%)
Elysian Wealth Fund (4.03%)
24.31%
FinancialQuarterly Results Snapshot (Consolidated) - Jun'26 - QoQ
 Compare with Peers
QoQ Growth in quarter ended Jun 2026 is 15.25% vs 21.70% in Mar 2026

QoQ Growth in quarter ended Jun 2026 is 162.57% vs -26.94% in Mar 2026

Half Yearly Results Snapshot (Consolidated) - Sep'25
Growth in half year ended Sep 2025 is 27.51% vs 0.67% in Sep 2024
Growth in half year ended Sep 2025 is 422.80% vs 151.17% in Sep 2024
Nine Monthly Results Snapshot (Consolidated) - Dec'25
YoY Growth in nine months ended Dec 2025 is 14.52% vs 2.99% in Dec 2024
YoY Growth in nine months ended Dec 2025 is 240.93% vs 67.64% in Dec 2024
Annual Results Snapshot (Consolidated) - Mar'26
YoY Growth in year ended Mar 2026 is 13.16% vs 5.68% in Mar 2025
YoY Growth in year ended Mar 2026 is 164.39% vs 36.92% in Mar 2025
 Company CV
About Manaksia Coated Metals & Industries Ltd

Company Coordinates










