
Compare Uflex with Similar Stocks
Dashboard
Weak Long Term Fundamental Strength with a -4.25% CAGR growth in Operating Profits over the last 5 years
- Low ability to service debt as the company has a high Debt to EBITDA ratio of 5.43 times
- The company has been able to generate a Return on Equity (avg) of 7.09% signifying low profitability per unit of shareholders funds
Despite the size of the company, domestic mutual funds hold only 0% of the company
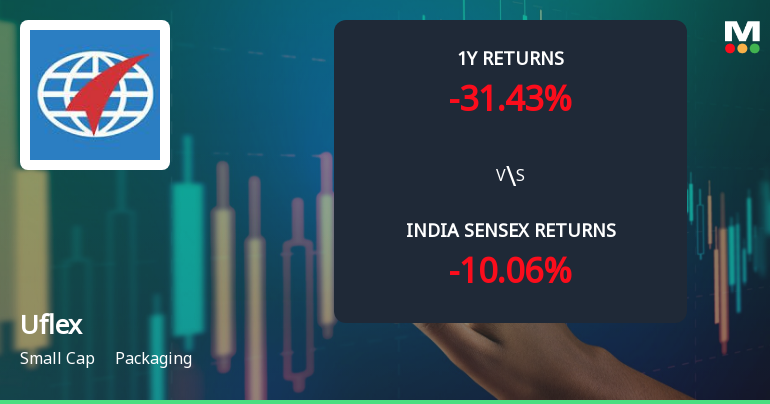
Below par performance in long term as well as near term
Total Returns (Price + Dividend) 
Latest dividend: 3 per share ex-dividend date: Aug-01-2025
Risk Adjusted Returns v/s
Returns Beta

News
Uflex Ltd Technical Momentum Shifts Amid Mixed Market Signals
Uflex Ltd, a small-cap player in the packaging sector, has experienced a notable shift in its technical momentum, reflecting a complex interplay of bullish and bearish signals across multiple timeframes. Despite a recent downgrade in its Mojo Grade to 'Sell' from 'Strong Sell', the stock’s price action and technical indicators reveal a nuanced picture that investors should carefully analyse amid broader market pressures.
Read full news article
Uflex Ltd Technical Momentum Shifts Amid Mixed Market Signals
Uflex Ltd, a small-cap player in the packaging sector, has exhibited a notable shift in its technical momentum, moving from a mildly bearish stance to a sideways trend. Despite a day gain of 2.04% to close at ₹448.30, the stock’s technical indicators present a complex picture, with mixed signals from MACD, RSI, moving averages, and other momentum oscillators. This analysis delves into the recent technical parameter changes and what they imply for investors navigating the packaging industry landscape.
Read full news articleAre Uflex Ltd latest results good or bad?
Uflex Ltd's latest financial results for the quarter ended March 2026 indicate a significant operational turnaround. The company reported consolidated net sales of ₹4,055.92 crores, reflecting a sequential growth of 12.29% compared to the previous quarter. This marks an all-time high for the company, showcasing its ability to capture market share amidst challenging conditions. The consolidated net profit stood at ₹196.02 crores, demonstrating a remarkable increase of 442.24% quarter-on-quarter, which highlights a strong recovery in profitability. The operating margin, excluding other income, improved to 14.80%, marking a sequential increase of 236 basis points. This improvement in margins can be attributed to better operating leverage and effective cost management, particularly in raw material procurement. The profit after tax margin also showed a notable enhancement, rising to 4.96% from 1.02% in the prev...
Read full news article Announcements
UFLEX Limited - Press Release
14-Nov-2019 | Source : NSEUFLEX Limited has informed the Exchange regarding a press release dated November 13, 2019, titled "UFlex Closes Q2 of FY19-20 with EBITDA of 279 cr (YoY Growth of 5.4%) & EBITDA Margin of 14.9%".
Analysts\/Institutional Investor Meet\/Con. Call Updates
20-Sep-2019 | Source : NSE
| UFLEX Limited has informed the Exchange regarding Analysts/Institutional Investor Meet/Con. Call Updates |
Updates
19-Sep-2019 | Source : NSE
| UFLEX Limited has informed the Exchange regarding 'Intimation for transfer of shares as per SEBI Circular No.SEBI/HO/MIRSD/DOS3/CIRP/P/2018/139 dated November 6,2018 w.r.t. Standardised norms for transfer of physical mode.'. |
Corporate Actions

No Upcoming Board Meetings

Uflex Ltd has declared 30% dividend, ex-date: 25 Jun 26

No Splits history available

No Bonus history available

No Rights history available
Quality key factors
Valuation key factors
Technicals key factors
 Technical Indicator Scale: Bearish, Mildly Bearish, Sideways, Mildly Bullish, Bullish Turned
 Shareholding Snapshot : Mar 2026
Shareholding Compare (%holding)
Non Institution
None
Held by 1 Schemes (0.0%)
Held by 62 FIIs (9.21%)
Flex International Pvt Ltd (13.3%)
Vistra Itcl (india) Limited (12.49%)
12.1%
Quarterly Results Snapshot (Consolidated) - Mar'26 - QoQ

QoQ Growth in quarter ended Mar 2026 is 12.29% vs -5.74% in Dec 2025
QoQ Growth in quarter ended Mar 2026 is 442.24% vs 34.34% in Dec 2025
Half Yearly Results Snapshot (Consolidated) - Sep'25

Growth in half year ended Sep 2025 is 3.28% vs 12.97% in Sep 2024
Growth in half year ended Sep 2025 is 152.08% vs 53.79% in Sep 2024
Nine Monthly Results Snapshot (Consolidated) - Dec'25
YoY Growth in nine months ended Dec 2025 is 1.09% vs 12.93% in Dec 2024
YoY Growth in nine months ended Dec 2025 is 561.26% vs 93.75% in Dec 2024
Annual Results Snapshot (Consolidated) - Mar'26
YoY Growth in year ended Mar 2026 is 2.42% vs 12.52% in Mar 2025
YoY Growth in year ended Mar 2026 is 122.81% vs 120.60% in Mar 2025
About Uflex Ltd

Company Coordinates


