
Compare EPL Ltd with Similar Stocks
Stock DNA
Packaging
INR 7,671 Cr (Small Cap)
18.00
35
2.10%
0.26
14.44%
2.67
Total Returns (Price + Dividend) 
Latest dividend: 2.4850709131624784 per share ex-dividend date: Nov-17-2025
Risk Adjusted Returns v/s
Returns Beta

News
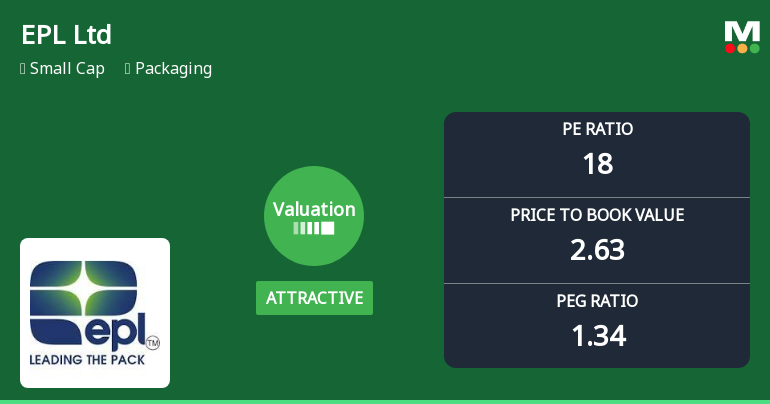
EPL Ltd Valuation Shifts Signal Attractive Entry Amid Packaging Sector Dynamics
EPL Ltd, a small-cap player in the packaging sector, has seen its valuation parameters shift favourably, prompting an upgrade in its investment grade from Hold to Buy. With a current price-to-earnings (P/E) ratio of 18.23 and price-to-book value (P/BV) of 2.63, the company now presents an attractive valuation compared to its historical averages and peer group, signalling potential value for investors amid a mixed market backdrop.
Read full news article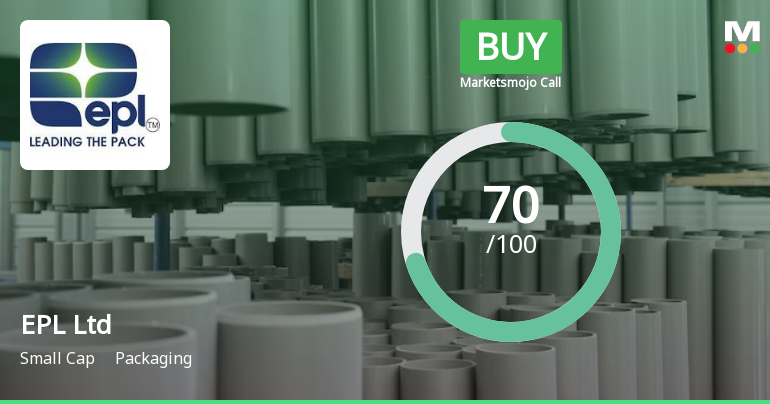
EPL Ltd is Rated Buy by MarketsMOJO
EPL Ltd is currently rated Buy by MarketsMOJO, with this rating last updated on 15 June 2026. While the rating change occurred on that date, the analysis and financial metrics discussed here reflect the stock’s current position as of 08 July 2026, providing investors with the most up-to-date view of the company’s fundamentals and market performance.
Read full news article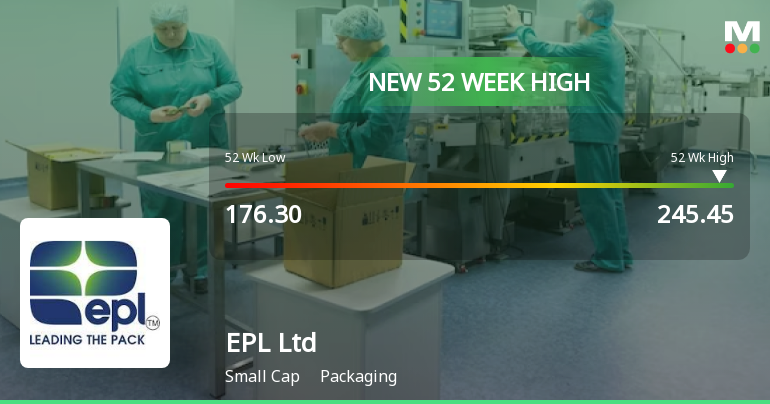
Broad-Based Technical Strength Lifts EPL Ltd to 52-Week High of Rs 245.45
Surging past its previous peaks, EPL Ltd reached a fresh 52-week high of Rs 245.45 on 7 Jul 2026, marking a notable milestone in its price momentum. This advance comes amid a sustained five-day rally that has delivered a 9.15% gain, outpacing its packaging sector peers and reflecting a strong technical alignment across multiple indicators.
Read full news article Announcements
Essel Propack Limited - Redemption
27-Nov-2019 | Source : NSEEssel Propack Limited has informed the Exchange about Redemption of Commercial Papers bearing ISIN- INE255A14601 amounting to Rs. 30 crores with maturity date of 27 November 2019
Essel Propack Limited - Other General Purpose
14-Nov-2019 | Source : NSEEssel Propack Limited has informed the Exchange regarding Submission of Half yearly disclosure on Related Party transaction
Essel Propack Limited - Credit Rating
13-Nov-2019 | Source : NSEEssel Propack Limited has informed the Exchange regarding Credit Rating.
Corporate Actions

No Upcoming Board Meetings

EPL Ltd has declared 125% dividend, ex-date: 17 Nov 25

EPL Ltd has announced 2:10 stock split, ex-date: 08 Jun 06

EPL Ltd has announced 1:1 bonus issue, ex-date: 20 Jun 18

No Rights history available
Quality key factors
Valuation key factors
Technicals key factors
 Technical Indicator Scale: Bearish, Mildly Bearish, Sideways, Mildly Bullish, Bullish Turned
 Shareholding Snapshot : Mar 2026
Shareholding Compare (%holding)
Non Institution
None
Held by 12 Schemes (6.98%)
Held by 172 FIIs (17.23%)
Epsilon Bidco Pte.ltd. (26.38%)
Indorama Netherlands B V (24.82%)
13.03%
Quarterly Results Snapshot (Consolidated) - Mar'26 - YoY

YoY Growth in quarter ended Mar 2026 is 17.65% vs 7.40% in Mar 2025

YoY Growth in quarter ended Mar 2026 is -9.97% vs 412.56% in Mar 2025
Half Yearly Results Snapshot (Consolidated) - Sep'25
Growth in half year ended Sep 2025 is 10.52% vs 9.51% in Sep 2024
Growth in half year ended Sep 2025 is 35.12% vs 44.27% in Sep 2024
Nine Monthly Results Snapshot (Consolidated) - Dec'25
YoY Growth in nine months ended Dec 2025 is 11.41% vs 7.66% in Dec 2024
YoY Growth in nine months ended Dec 2025 is 16.88% vs 28.18% in Dec 2024
Annual Results Snapshot (Consolidated) - Mar'26
YoY Growth in year ended Mar 2026 is 13.05% vs 7.59% in Mar 2025
YoY Growth in year ended Mar 2026 is 8.33% vs 68.39% in Mar 2025
About EPL Ltd

Company Coordinates


