Tata Steel

  • Market Cap: Large Cap
  • Industry: Ferrous Metals
  • ISIN: INE081A01020
  • NSEID: TATASTEEL
  • BSEID: 500470
INR
181.99
-4.51 (-2.42%)
BSENSE

Aug 31, 09:39 AM

BSE+NSE Vol: 54.5 lacs

  • Price Points
  • Score
  • Mojo Parameters
  • Total Return
  • News and Corporate Actions
  • Key factors
  • Shareholding
  • Financials
  • CompanyCV
stock-summaryPrice Point
High/Low

1Day

52 Week

Valuation
Technical
Day's Volume

CASH

54.5 lacs (75.17%) Volume

Shareholding (Jun 2026)

FII

18.90%

Held by 863 FIIs

DII

27.10%

Held by 627 DIIs

Promoter

32.94%

Why is Tata Steel Ltd falling/rising?

31-Aug-2026

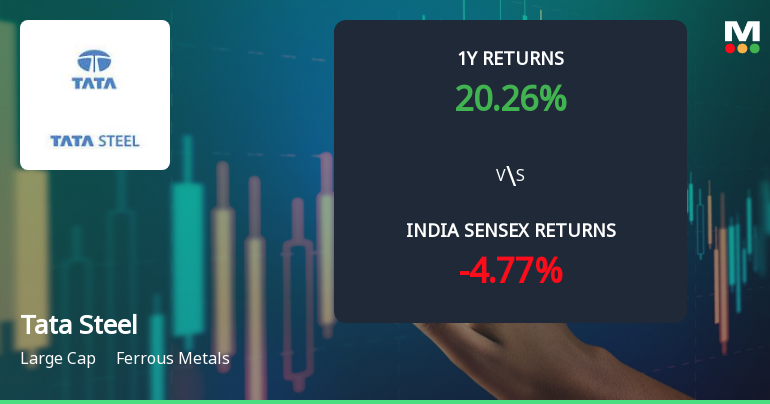
As of 30-Aug, Tata Steel Ltd's stock price is at 186.20, reflecting a slight decline of 0.2%. Despite recent short-term declines, the stock has shown strong long-term performance with a 21.26% return over the past year and consistent positive financial results.

As of 30-Aug, Tata Steel Ltd's stock price is currently at 186.20, reflecting a slight decline of 0.2 (-0.11%). The stock has been underperforming recently, having fallen consecutively for the last two days, resulting in a total decline of 1.19% during this period. Additionally, it has underperformed its sector by 0.6% today.<BR><BR>Despite these short-term declines, Tata Steel has shown positive performance over longer periods. For instance, over the past year, the stock has generated a return of 21.26%, significantly outperforming the broader market, which has only returned 3.91%. The company has also declared positive results for the last six consecutive quarters, with a remarkable growth in profit after tax (PAT) of 110.03% over the last nine months.<BR><BR>Investor participation has been rising, as evidenced by a 38.91% increase in delivery volume on August 27 compared to the five-day average. However, the stock's moving averages indicate that it is currently lower than the 20-day, 50-day, 100-day, and 200-day moving averages, which may contribute to the perception of a downward trend.<BR><BR>In summary, while Tata Steel Ltd has demonstrated strong long-term performance and positive financial results, recent short-term declines and underperformance against its sector are contributing to the current fall in stock price.

View full answer

Should I buy, sell or hold Tata Steel Ltd?

14-Aug-2026

Who are in the management team of Tata Steel?

14-Aug-2026

The management team of Tata Steel includes key figures such as Ratan N Tata (Chairman Emeritus), N Chandrasekaran (Chairman), T V Narendran (Managing Director & CEO), and Koushik Chatterjee (CFO), along with several independent directors. They are responsible for guiding the company's strategic direction and operations.

The management team of Tata Steel includes the following key individuals:<BR><BR>1. **Ratan N Tata** - Chairman Emeritus<BR>2. **N Chandrasekaran** - Chairman (Non-Executive)<BR>3. **Koushik Chatterjee** - Whole Time Director & CFO<BR>4. **T V Narendran** - Managing Director & CEO<BR>5. **K Parvatheesam** - Company Secretary & Compliance Officer<BR>6. **Deepak Kapoor** - Independent Director<BR>7. **Saurabh Agrawal** - Director<BR>8. **N N Tata** - Vice Chairman<BR>9. **V K Sharma** - Independent Director<BR>10. **Farida Khambata** - Independent Director<BR>11. **Bharti Gupta Ramola** - Independent Director<BR>12. **Shekhar C Mande** - Independent Director<BR><BR>This team plays a crucial role in guiding the strategic direction and operations of Tata Steel.

View full answer

What does Tata Steel do?

14-Aug-2026

Tata Steel Ltd, one of the largest steel companies globally, operates in the Ferrous Metals industry and reported net sales of ₹60,794 Cr and a net profit of ₹2,318 Cr for June 2026. The company has a market cap of ₹231,320 Cr and key metrics include a P/E ratio of 19.00 and a dividend yield of 2.16%.

Overview: <BR>Tata Steel Ltd is one of the world's largest steel companies operating in the Ferrous Metals industry and is categorized as a Large Cap company.<BR><BR>History: <BR>Tata Steel was initially incorporated in 1907 under the name 'Tata Iron & Steel Company Limited' and changed its name to Tata Steel Limited on May 19, 2005. The most recent quarterly results reported net sales and net profit for June 2026.<BR><BR>Financial Snapshot: <BR>Net Sales: 60,794 Cr (Quarterly Results - Jun 2026) <BR>Net Profit: 2,318 Cr (Quarterly Results - Jun 2026) <BR>Market Cap: INR 231,320 Cr (Large Cap)<BR><BR>Key Metrics: <BR>P/E: 19.00 <BR>Industry P/E: 24 <BR>Dividend Yield: 2.16% <BR>Debt-Equity: 0.80 <BR>Return on Equity: 11.26% <BR>Price to Book: 2.27<BR><BR>Contact Details: <BR>Address: Bombay House, 24 Homi Mody Street Fort Mumbai Maharashtra : 400001 <BR>Tel: 91-022-66658282 <BR>Email: cosec@tatasteel.com <BR>Website: http://www.tatasteel.com

View full answer

Who are the peers of the Tata Steel?

14-Aug-2026

Tata Steel's peers include JSW Steel, Jindal Steel, Lloyds Metals, SAIL, Jindal Stainless, KIOCL, Sarda Energy, NMDC Steel, and Indian Metals. Indian Metals leads in 1-year returns at 80.14%, while Tata Steel has a return of 15.45%, and Sarda Energy has the lowest at -5.95%.

Peers: The peers of Tata Steel are JSW Steel, Jindal Steel, Lloyds Metals, SAIL, Jindal Stain., KIOCL, Sarda Energy, NMDC Steel, and Indian Metals.<BR><BR>Quality Snapshot: Excellent management risk is observed at JSW Steel, Jindal Steel, Lloyds Metals, Jindal Stain., and the rest. Average management risk is found at SAIL, Sarda Energy, NMDC Steel, and Indian Metals. Good growth is seen at Lloyds Metals and Jindal Stain., while below average growth is noted at JSW Steel, Tata Steel, Jindal Steel, SAIL, KIOCL, and the rest. Excellent capital structure is present at Lloyds Metals and Indian Metals, while good capital structure is found at Jindal Steel, Sarda Energy, and the rest. Average capital structure is noted at Tata Steel, while below average capital structure is observed at JSW Steel, SAIL, and KIOCL.<BR><BR>Return Snapshot: The peer with the highest 1-year return is Indian Metals at 80.14%, while Tata Steel has a 1-year return of 15.45%, which is lower than Indian Metals. The peer with the lowest 1-year return is Sarda Energy at -5.95%. Additionally, peers with negative six-month returns include Tata Steel, Jindal Steel, KIOCL, and Sarda Energy.

View full answer

How big is Tata Steel?

14-Aug-2026

As of 14th August, Tata Steel Ltd has a market capitalization of 229,197.56 Cr, with recent net sales of 239,756.11 Cr and a net profit of 11,034.54 Cr. Shareholder's funds are 102,167.65 Cr, and total assets amount to 296,514.62 Cr.

As of 14th August, Tata Steel Ltd has a market capitalization of 229,197.56 Cr, categorizing it as a Large Cap company.<BR><BR>In the latest four quarters, Tata Steel reported Net Sales of 239,756.11 Cr and a Net Profit of 11,034.54 Cr.<BR><BR>For the latest annual period ending in March 2026, Tata Steel's Shareholder's Funds amounted to 102,167.65 Cr, while Total Assets were reported at 296,514.62 Cr.

View full answer

Are Tata Steel Ltd latest results good or bad?

31-Jul-2026

Tata Steel's latest results show strong year-on-year growth with a net profit increase of 11.58% and net sales up 14.32%. However, there are concerns due to sequential declines in both profit and sales, indicating short-term challenges despite overall positive annual performance.

Tata Steel's latest results present a mixed picture. On one hand, the company reported a consolidated net profit of ₹2,318.35 crores for Q1 FY27, which is an 11.58% increase year-on-year, indicating strong annual growth. Additionally, net sales rose by 14.32% year-on-year to ₹60,794 crores, reflecting improved steel realizations and volume recovery.<BR><BR>However, there are notable concerns. The quarter saw a sequential decline in both net profit and net sales, with profits dropping by 20.76% and sales contracting by 3.91% compared to the previous quarter. This decline can be attributed to seasonal demand softness and higher costs, including increased depreciation and interest expenses.<BR><BR>Operating margins also faced pressure, decreasing to 15.34% from 15.68% in the previous quarter, although they improved from 14.08% a year ago. The company's return on capital employed (ROCE) reached a series high of 12.42%, showcasing improved capital efficiency.<BR><BR>In summary, while Tata Steel's year-on-year performance shows positive growth, the sequential declines and margin pressures indicate challenges that could affect short-term performance. Overall, the results can be seen as good in terms of annual growth but concerning when looking at the quarter-on-quarter performance.

View full answer

When is the next results date for Tata Steel Ltd?

08-May-2026

The next results date for Tata Steel Ltd is 15 May 2026.

The next results date for Tata Steel Ltd is scheduled for 15 May 2026.

View full answer

Is Tata Steel technically bullish or bearish?

05-Dec-2025

As of December 4, 2025, Tata Steel's technical trend is neutral with mixed signals, showing mild bearishness on weekly indicators and bullishness on monthly indicators, indicating a lack of strong momentum in either direction.

As of 4 December 2025, the technical trend for Tata Steel has changed from mildly bullish to sideways. The current technical stance is neutral, with mixed signals across different time frames. The weekly MACD and KST are both mildly bearish, while the monthly MACD and KST remain bullish. The RSI shows no signal on the weekly chart and is bearish on the monthly. Bollinger Bands indicate a bearish stance on the weekly and a mildly bullish stance on the monthly. Moving averages are mildly bullish on the daily chart. Overall, the indicators suggest a lack of strong momentum in either direction, leading to a neutral outlook.

View full answer

How has been the historical performance of Tata Steel?

04-Dec-2025

Tata Steel's historical performance shows a decline in net sales and operating income from March 2023 to March 2025, with fluctuating operating profits and a recovery in profit before tax. Despite low profit after tax in March 2025, total assets and cash flow from operating activities improved during this period.

Answer:<BR>The historical performance of Tata Steel shows fluctuations in key financial metrics over the years, with notable changes in net sales, profits, and expenditures.<BR><BR>Breakdown:<BR>Tata Steel's net sales have seen a decline from INR 2,43,352.69 crore in March 2023 to INR 2,18,542.51 crore in March 2025. The total operating income followed a similar trend, decreasing from INR 2,43,352.69 crore in March 2023 to INR 2,18,542.51 crore in March 2025. The total expenditure, excluding depreciation, also decreased from INR 2,11,052.53 crore in March 2023 to INR 1,93,244.06 crore in March 2025. Operating profit (PBDIT) has fluctuated, peaking at INR 64,274.84 crore in March 2022 before dropping to INR 26,838.98 crore in March 2025. Profit before tax showed a significant recovery from a loss of INR 1,089.06 crore in March 2024 to a profit of INR 8,222.06 crore in March 2025. However, profit after tax remained low at INR 2,982.97 crore in March 2025, following a loss in the previous year. The company's total assets increased from INR 2,69,312.42 crore in March 2024 to INR 2,75,458.58 crore in March 2025, while total liabilities also rose slightly from INR 2,69,312.42 crore to INR 2,75,458.58 crore. Cash flow from operating activities improved to INR 23,511 crore in March 2025, compared to INR 20,300 crore in March 2024, indicating a positive trend in cash generation.

View full answer

Is Tata Steel overvalued or undervalued?

17-Nov-2025

As of November 14, 2025, Tata Steel is considered undervalued with an attractive valuation grade, featuring a PE ratio of 29.20, an EV to EBITDA of 10.58, a PEG ratio of 0.24, and a ROCE of 9.81%, while outperforming the Sensex with a year-to-date return of 26.10%.

As of 14 November 2025, Tata Steel's valuation grade has moved from fair to attractive, indicating a more favorable assessment of its market position. The company is currently considered undervalued. Key ratios include a PE ratio of 29.20, an EV to EBITDA of 10.58, and a PEG ratio of 0.24, which suggests strong growth potential relative to its price.<BR><BR>In comparison to its peers, Tata Steel's PE ratio is significantly lower than JSW Steel's 46.61 and Jindal Steel's 27.71, while maintaining a competitive EV to EBITDA ratio against Jindal Steel's 13.05. Additionally, Tata Steel's return on capital employed (ROCE) stands at 9.81%, reinforcing its operational efficiency. Despite a recent decline in stock price compared to the Sensex, Tata Steel has shown robust performance over the longer term, with a year-to-date return of 26.10% versus the Sensex's 8.22%.

View full answer

Who are the top shareholders of the Tata Steel?

06-Jun-2025

The top shareholders of Tata Steel include Tata Sons Private Limited with 31.76%, foreign institutional investors holding 18.29%, and mutual funds accounting for 12.04%. Individual investors own 20.05% of the shares, with no pledged promoter holdings.

The top shareholders of Tata Steel include a mix of promoters, institutional investors, and individual investors. The majority shareholder is Tata Sons Private Limited, which holds 31.76% of the shares. Additionally, foreign institutional investors (FIIs) collectively hold 18.29% of the company, while mutual funds are represented by 62 schemes, accounting for 12.04%. Individual investors hold 20.05% of the shares. Notably, there are no pledged promoter holdings, and the highest public shareholder is the Life Insurance Corporation of India, which holds 0%.

View full answer

Has Tata Steel declared dividend?

06-Jun-2025

Yes, Tata Steel has declared a dividend of 360% (₹3.6 per share) with an ex-date of June 6, 2025. The company has shown strong total returns over various periods, particularly a remarkable 640.86% total return over the last 5 years.

Tata Steel Ltd has declared a dividend.<BR><BR>Dividend Details:<BR>- Percentage announced: 360%<BR>- Amount per share: 3.6<BR>- Ex-date: 06 Jun 25<BR><BR>Dividend Yield: 2.28%.<BR><BR>Total Returns by Period:<BR>In the last 6 months, Tata Steel experienced a price return of 5.9%, with no dividend return, resulting in a total return of 5.9%.<BR><BR>Over the past year, the company had a price return of -8.72% and a dividend return of 1.99%, leading to a total return of -6.73%.<BR><BR>In the 2-year period, Tata Steel achieved a price return of 44.04% and a dividend return of 6.32%, culminating in a total return of 50.36%.<BR><BR>For the 3-year period, the price return was 45.61% with a dividend return of 8.59%, resulting in a total return of 54.2%.<BR><BR>In the last 4 years, the company had a price return of 40.19% and a substantial dividend return of 49.15%, giving a total return of 89.34%.<BR><BR>Over the past 5 years, Tata Steel saw an impressive price return of 362.65% alongside a dividend return of 278.21%, leading to a remarkable total return of 640.86%.<BR><BR>Overall, Tata Steel has declared a significant dividend and has shown strong total returns over longer periods, particularly in the 5-year timeframe, indicating robust performance and shareholder value creation.

View full answer
iScoreScore
Click here to find our call on this stock
Strong Sell
Sell
Hold
Buy
Strong Buy

Dashboard

1

Poor long term growth as Operating profit has grown by an annual rate -8.63% of over the last 5 years

 
stock-summaryMojo Parameters

Mojo Parameters

Loading Valuation Snapshot...

Stock DNA

stock-summary
Industry

Ferrous Metals

stock-summary
Market cap

INR 232,443 Cr (Large Cap)

stock-summary
P/E

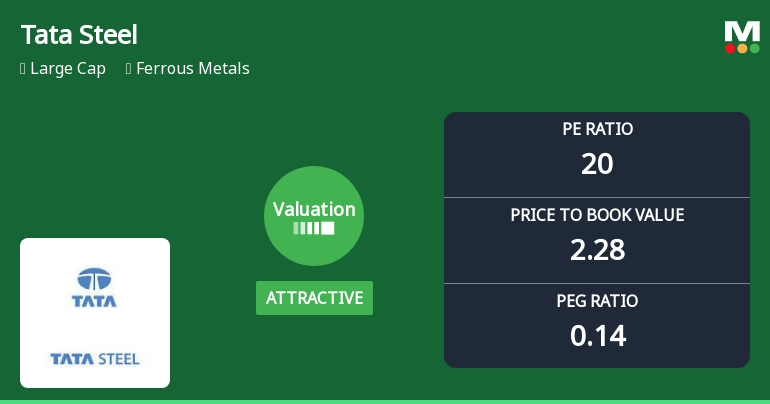
20.00

stock-summary
Industry P/E

25

stock-summary
Dividend Yield

2.15%

stock-summary
Debt Equity

0.80

stock-summary
Return on Equity

11.26%

stock-summary
Price to Book

2.28

Revenue and Profits:
Net Sales:
60,794 Cr
(Quarterly Results - Jun 2026)
Net Profit:
2,318 Cr
stock-summaryTotal Returns
Total Returns (Price + Dividend) stock-summary
Dividend Yield (2.15%)
TimePeriod
Price Return
Dividend Return
Total Return
3 Months
-12.51%
1.90%
-10.61%
6 Months
-13.75%
2.03%
-11.72%
1 Year
17.81%
2.39%
20.2%
2 Years
19.13%
2.68%
21.81%
3 Years
48.08%
5.83%
53.91%
4 Years
68.04%
10.72%
78.76%
5 Years
25.48%
12.83%
38.31%

Latest dividend: 4 per share ex-dividend date: Jun-12-2026

Risk Adjusted Returns v/s stock-summary
Returns Beta
Icon
Beta has not been calculated since enough price history is not available
stock-summaryNews & Corporate Actions

News

Tata Steel Gains 1.97%: 8 Key Factors Driving the Week’s Mixed Momentum

Announcements stock-summary

Tata Steel Limited - Updates

09-Dec-2019 | Source : NSE

Tata Steel Limited has informed the Exchange regarding 'Newspaper advertisement for record date for 10.25% Non-Convertible Debentures Rs. 500 Crore ISIN INE081A08140'.

Tata Steel Limited - Updates

05-Dec-2019 | Source : NSE

Tata Steel Limited has informed the Exchange regarding 'Record Date for interest payment on 10.25% Non-Convertible Debentures (NCDs) Rs. 500 Crore: ISIN INE081A08140'.

Tata Steel Limited - Analysts/Institutional Investor Meet/Con. Call Updates

22-Nov-2019 | Source : NSE

Tata Steel Limited has informed the Exchange regarding Analysts/Institutional Investor Meet/Con. Call Updates

Corporate Actions stock-summary

stock-summary
BOARD MEETING

No Upcoming Board Meetings

stock-summary
DIVIDEND

Tata Steel Ltd has declared 400% dividend, ex-date: 12 Jun 26

stock-summary
SPLITS

Tata Steel Ltd has announced 1:10 stock split, ex-date: 28 Jul 22

stock-summary
BONUS

No Bonus history available

stock-summary
RIGHTS

Tata Steel Ltd has announced 4:25 rights issue, ex-date: 31 Jan 18

stock-summaryKey Factors

Quality key factors stock-summary

Factor
Value
Sales Growth (5y)
5.67%
EBIT Growth (5y)
-8.63%
EBIT to Interest (avg)
4.01
Debt to EBITDA (avg)
2.88
Net Debt to Equity (avg)
0.80
Sales to Capital Employed (avg)
1.24
Tax Ratio
32.71%
Dividend Payout Ratio
46.23%
Pledged Shares
0
Institutional Holding
46.01%
ROCE (avg)
15.27%
ROE (avg)
12.31%

Valuation key factors

Factor
Value
P/E Ratio
20
Industry P/E
25
Price to Book Value
2.28
EV to EBIT
13.44
EV to EBITDA
8.67
EV to Capital Employed
1.71
EV to Sales
1.31
PEG Ratio
0.14
Dividend Yield
2.15%
ROCE (Latest)
12.21%
ROE (Latest)
11.26%

Technicals key factors

Indicator
Weekly
Monthly
MACD
Bearish
Mildly Bearish
RSI
No Signal
No Signal
Bollinger Bands
Mildly Bearish
Mildly Bullish
Moving Averages
Bearish (Daily)
KST
Bearish
Bullish
Dow Theory
Mildly Bearish
Mildly Bearish
OBV
Mildly Bearish
Mildly Bearish
stock-summary Technical Indicator Scale: Bearish, Mildly Bearish, Sideways, Mildly Bullish, Bullish  Turned 
stock-summaryShareholding
Shareholding Snapshot : Jun 2026stock-summary
Shareholding Compare (%holding) stock-summary
Majority shareholders

Promoters

Pledged Promoter Holdings

None

Mutual Funds

Held by 73 Schemes (14.71%)

FIIs

Held by 863 FIIs (18.9%)

Promoter with highest holding

Tata Sons Private Limited (31.76%)

Highest Public shareholder

Life Insurance Corporation Of India (6.37%)

Individual Investors Holdings

17.85%

stock-summaryFinancial
[
  {
    "link": "quarterly",
    "btn_text": "All Quarterly Results",
    "header": "Quarterly Results Snapshot (Consolidated) - Jun'26 - QoQ",
    "rhs": [
      {
        "prefix": "Net Sales ",
        "suffix": "QoQ Growth in quarter ended Jun 2026 is -3.91% vs 11.00% in Mar 2026",
        "dir": -1
      },
      {
        "prefix": "Consolidated Net Profit ",
        "suffix": "QoQ Growth in quarter ended Jun 2026 is -20.76% vs 8.82% in Mar 2026",
        "dir": -1
      }
    ],
    "table": {
      "header": [
        "Jun'26",
        "Mar'26",
        "Change(%)"
      ],
      "body": [
        {
          "field": "Net Sales",
          "val1": "60,794.29",
          "val2": "63,270.13",
          "chgp": "-3.91%",
          "chgp_class": "negative"
        },
        {
          "field": "Operating Profit (PBDIT) excl Other Income",
          "val1": "9,264.34",
          "val2": "9,828.66",
          "chgp": "-5.74%",
          "chgp_class": "negative"
        },
        {
          "field": "Interest",
          "val1": "1,770.51",
          "val2": "1,792.38",
          "chgp": "-1.22%",
          "chgp_class": "positive"
        },
        {
          "field": "Exceptional Items",
          "val1": "-345.48",
          "val2": "-340.05",
          "chgp": "-1.60%",
          "chgp_class": "negative"
        },
        {
          "field": "Consolidate Net Profit",
          "val1": "2,318.35",
          "val2": "2,925.74",
          "chgp": "-20.76%",
          "chgp_class": "negative"
        },
        {
          "field": "Operating Profit Margin (Excl OI)",
          "val1": "15.34%",
          "val2": "15.68%",
          "chgp": "-0.34%",
          "chgp_class": "negative"
        }
      ]
    }
  },
  {
    "link": "half-yearly",
    "btn_text": "All Half Yearly Results",
    "header": "Half Yearly Results Snapshot (Consolidated) - Sep'25",
    "rhs": [
      {
        "prefix": "Net Sales ",
        "suffix": " Growth in half year ended Sep 2025 is 2.94% vs -5.64% in Sep 2024",
        "dir": 1
      },
      {
        "prefix": "Consolidated Net Profit ",
        "suffix": " Growth in half year ended Sep 2025 is 188.86% vs 132.24% in Sep 2024",
        "dir": 1
      }
    ],
    "table": {
      "header": [
        "Sep'25",
        "Sep'24",
        "Change(%)"
      ],
      "body": [
        {
          "field": "Net Sales",
          "val1": "1,11,867.41",
          "val2": "1,08,676.10",
          "chgp": "2.94%",
          "chgp_class": "positive"
        },
        {
          "field": "Operating Profit (PBDIT) excl Other Income",
          "val1": "16,324.08",
          "val2": "12,835.74",
          "chgp": "27.18%",
          "chgp_class": "positive"
        },
        {
          "field": "Interest",
          "val1": "3,627.39",
          "val2": "3,748.11",
          "chgp": "-3.22%",
          "chgp_class": "positive"
        },
        {
          "field": "Exceptional Items",
          "val1": "-552.53",
          "val2": "-339.84",
          "chgp": "-62.59%",
          "chgp_class": "negative"
        },
        {
          "field": "Consolidate Net Profit",
          "val1": "5,179.43",
          "val2": "1,793.06",
          "chgp": "188.86%",
          "chgp_class": "positive"
        },
        {
          "field": "Operating Profit Margin (Excl OI)",
          "val1": "14.71%",
          "val2": "11.90%",
          "chgp": "2.81%",
          "chgp_class": "positive"
        }
      ]
    }
  },
  {
    "link": "nine-monthly",
    "btn_text": "All Nine Monthly Results",
    "header": "Nine Monthly Results Snapshot (Consolidated) - Dec'25",
    "rhs": [
      {
        "prefix": "Net Sales ",
        "suffix": "YoY Growth in nine months ended Dec 2025 is 4.03% vs -4.79% in Dec 2024",
        "dir": 1
      },
      {
        "prefix": "Consolidated Net Profit ",
        "suffix": "YoY Growth in nine months ended Dec 2025 is 271.19% vs 141.98% in Dec 2024",
        "dir": 1
      }
    ],
    "table": {
      "header": [
        "Dec'25",
        "Dec'24",
        "Change(%)"
      ],
      "body": [
        {
          "field": "Net Sales",
          "val1": "1,68,869.81",
          "val2": "1,62,324.40",
          "chgp": "4.03%",
          "chgp_class": "positive"
        },
        {
          "field": "Operating Profit (PBDIT) excl Other Income",
          "val1": "24,523.78",
          "val2": "18,739.23",
          "chgp": "30.87%",
          "chgp_class": "positive"
        },
        {
          "field": "Interest",
          "val1": "5,374.68",
          "val2": "5,552.20",
          "chgp": "-3.20%",
          "chgp_class": "positive"
        },
        {
          "field": "Exceptional Items",
          "val1": "-692.41",
          "val2": "-466.03",
          "chgp": "-48.58%",
          "chgp_class": "negative"
        },
        {
          "field": "Consolidate Net Profit",
          "val1": "7,868.13",
          "val2": "2,119.70",
          "chgp": "271.19%",
          "chgp_class": "positive"
        },
        {
          "field": "Operating Profit Margin (Excl OI)",
          "val1": "14.52%",
          "val2": "11.54%",
          "chgp": "2.98%",
          "chgp_class": "positive"
        }
      ]
    }
  },
  {
    "link": "annual",
    "btn_text": "All Annual Results",
    "header": "Annual Results Snapshot (Consolidated) - Mar'26",
    "rhs": [
      {
        "prefix": "Net Sales ",
        "suffix": "YoY Growth in year ended Mar 2026 is 6.22% vs -4.64% in Mar 2025",
        "dir": 1
      },
      {
        "prefix": "Consolidated Net Profit ",
        "suffix": "YoY Growth in year ended Mar 2026 is 215.56% vs 177.08% in Mar 2025",
        "dir": 1
      }
    ],
    "table": {
      "header": [
        "Mar'26",
        "Mar'25",
        "Change(%)"
      ],
      "body": [
        {
          "field": "Net Sales",
          "val1": "2,32,139.94",
          "val2": "2,18,542.51",
          "chgp": "6.22%",
          "chgp_class": "positive"
        },
        {
          "field": "Operating Profit (PBDIT) excl Other Income",
          "val1": "34,352.44",
          "val2": "25,298.45",
          "chgp": "35.79%",
          "chgp_class": "positive"
        },
        {
          "field": "Interest",
          "val1": "7,167.06",
          "val2": "7,340.95",
          "chgp": "-2.37%",
          "chgp_class": "positive"
        },
        {
          "field": "Exceptional Items",
          "val1": "-1,032.46",
          "val2": "-854.64",
          "chgp": "-20.81%",
          "chgp_class": "negative"
        },
        {
          "field": "Consolidate Net Profit",
          "val1": "10,793.87",
          "val2": "3,420.51",
          "chgp": "215.56%",
          "chgp_class": "positive"
        },
        {
          "field": "Operating Profit Margin (Excl OI)",
          "val1": "14.92%",
          "val2": "11.67%",
          "chgp": "3.25%",
          "chgp_class": "positive"
        }
      ]
    }
  }
]

Quarterly Results Snapshot (Consolidated) - Jun'26 - QoQstock-summary

Jun'26
Mar'26
Change(%)
Net Sales
60,794.29
63,270.13
-3.91%
Operating Profit (PBDIT) excl Other Income
9,264.34
9,828.66
-5.74%
Interest
1,770.51
1,792.38
-1.22%
Exceptional Items
-345.48
-340.05
-1.60%
Consolidate Net Profit
2,318.35
2,925.74
-20.76%
Operating Profit Margin (Excl OI)
15.34%
15.68%
-0.34%
Values in Rs Cr.
Direction Arrows
Net Sales

QoQ Growth in quarter ended Jun 2026 is -3.91% vs 11.00% in Mar 2026

Direction Arrows
Consolidated Net Profit

QoQ Growth in quarter ended Jun 2026 is -20.76% vs 8.82% in Mar 2026

Half Yearly Results Snapshot (Consolidated) - Sep'25stock-summary

Sep'25
Sep'24
Change(%)
Net Sales
1,11,867.41
1,08,676.10
2.94%
Operating Profit (PBDIT) excl Other Income
16,324.08
12,835.74
27.18%
Interest
3,627.39
3,748.11
-3.22%
Exceptional Items
-552.53
-339.84
-62.59%
Consolidate Net Profit
5,179.43
1,793.06
188.86%
Operating Profit Margin (Excl OI)
14.71%
11.90%
2.81%
Values in Rs Cr.
Direction Arrows
Net Sales

Growth in half year ended Sep 2025 is 2.94% vs -5.64% in Sep 2024

Direction Arrows
Consolidated Net Profit

Growth in half year ended Sep 2025 is 188.86% vs 132.24% in Sep 2024

Nine Monthly Results Snapshot (Consolidated) - Dec'25stock-summary

Dec'25
Dec'24
Change(%)
Net Sales
1,68,869.81
1,62,324.40
4.03%
Operating Profit (PBDIT) excl Other Income
24,523.78
18,739.23
30.87%
Interest
5,374.68
5,552.20
-3.20%
Exceptional Items
-692.41
-466.03
-48.58%
Consolidate Net Profit
7,868.13
2,119.70
271.19%
Operating Profit Margin (Excl OI)
14.52%
11.54%
2.98%
Values in Rs Cr.
Direction Arrows
Net Sales

YoY Growth in nine months ended Dec 2025 is 4.03% vs -4.79% in Dec 2024

Direction Arrows
Consolidated Net Profit

YoY Growth in nine months ended Dec 2025 is 271.19% vs 141.98% in Dec 2024

Annual Results Snapshot (Consolidated) - Mar'26stock-summary

Mar'26
Mar'25
Change(%)
Net Sales
2,32,139.94
2,18,542.51
6.22%
Operating Profit (PBDIT) excl Other Income
34,352.44
25,298.45
35.79%
Interest
7,167.06
7,340.95
-2.37%
Exceptional Items
-1,032.46
-854.64
-20.81%
Consolidate Net Profit
10,793.87
3,420.51
215.56%
Operating Profit Margin (Excl OI)
14.92%
11.67%
3.25%
Values in Rs Cr.
Direction Arrows
Net Sales

YoY Growth in year ended Mar 2026 is 6.22% vs -4.64% in Mar 2025

Direction Arrows
Consolidated Net Profit

YoY Growth in year ended Mar 2026 is 215.56% vs 177.08% in Mar 2025

stock-summaryCompany CV
About Tata Steel Ltd stock-summary
stock-summary
Tata Steel Ltd
Large Cap
Ferrous Metals
Tata Steel Limited was initially incorporated in 1907 with the name 'Tata Iron & Steel Company Limited'. The name of the Company was changed from Tata Iron & Steel Company Limited to Tata Steel Limited dated May 19, 2005. Tata Steel is one of the world's largest steel companies with a global annual crude steel production capacity of 36 million tonnes per annum (MnTPA).
Company Coordinates stock-summary
Company Details
Bombay House, 24 Homi Mody Street Fort Mumbai Maharashtra : 400001
stock-summary
Tel: 91-022-66658282
stock-summary
cosec@tatasteel.com
Registrar Details
TSR Darashaw Ltd, 6-10 , Haji Moosa Patrawala Indl. Est , 20 Dr.E.Moses Road , Mahalaxmi , Mumbai