
Compare Lloyds Metals with Similar Stocks
Dashboard
Strong Long Term Fundamental Strength with an average Return on Equity (ROE) of 37.65%
- Healthy long term growth as Net Sales has grown by an annual rate of 132.22% and Operating profit at 351.27%
- Strong ability to service debt as the company has a low Debt to EBITDA ratio of 3.10 times
With a growth in Operating Profit of 811.87%, the company declared Outstanding results in Mar 26
Majority shareholders : Promoters
Company is among the highest 1% of companies rated by MarketsMojo across all 4,000 stocks
Market Beating performance in long term as well as near term
Stock DNA
Ferrous Metals
INR 108,452 Cr (Mid Cap)
29.00
25
0.05%
0.94
13.01%
7.84
Total Returns (Price + Dividend) 
Latest dividend: 1 per share ex-dividend date: Jun-12-2026
Risk Adjusted Returns v/s
Returns Beta

News
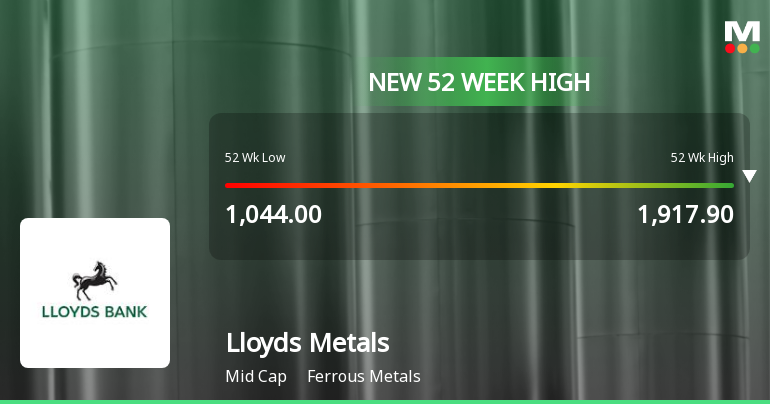
Broad-Based Technical Strength Lifts Lloyds Metals & Energy Ltd to 52-Week High of Rs 1931.75
With a decisive break above Rs 1931.75 on 21 Jul 2026, Lloyds Metals & Energy Ltd has reached a new 52-week and all-time high, propelled by a confluence of robust technical indicators and sustained price momentum that outpaces its sector and the broader market.
Read full news article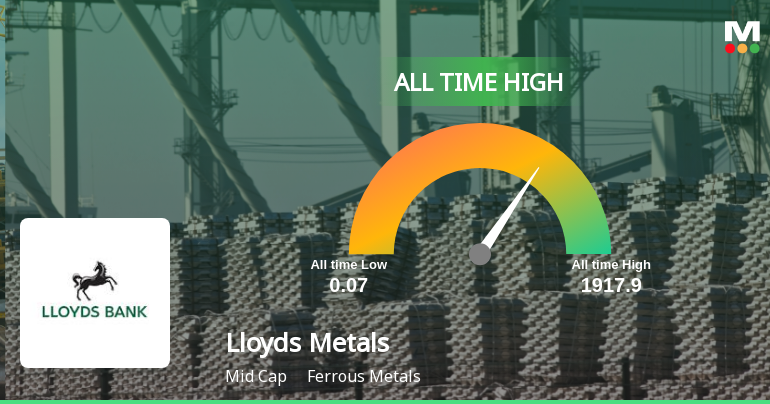
Lloyds Metals & Energy Ltd Hits All-Time High of Rs 1,917.90 as Momentum Builds Across Timeframes
Extending its winning streak to three sessions, Lloyds Metals & Energy Ltd touched a fresh all-time high of Rs 1,917.90 on 21 Jul 2026, marking a 0.77% gain on the day and continuing its strong outperformance against the Sensex.
Read full news article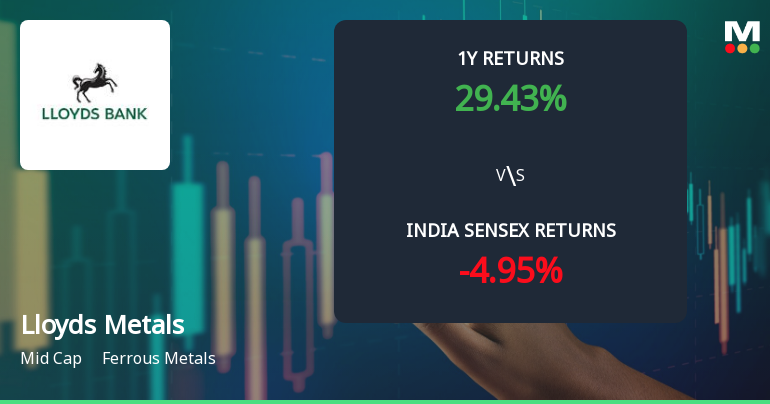
Lloyds Metals & Energy Ltd Technical Momentum Shifts Signal Strong Buy
Lloyds Metals & Energy Ltd has demonstrated a significant shift in technical momentum, moving from a mildly bullish stance to a more confident bullish trend. This transition is supported by a confluence of positive signals from key technical indicators including MACD, moving averages, and Bollinger Bands, suggesting robust price momentum and potential for further gains in the ferrous metals sector.
Read full news article Announcements
Corporate Actions

No Upcoming Board Meetings

Lloyds Metals & Energy Ltd has declared 100% dividend, ex-date: 12 Jun 26

Lloyds Metals & Energy Ltd has announced 1:2 stock split, ex-date: 26 Jul 16

No Bonus history available

No Rights history available
Quality key factors
Valuation key factors
Technicals key factors
 Technical Indicator Scale: Bearish, Mildly Bearish, Sideways, Mildly Bullish, Bullish Turned
 Shareholding Snapshot : Jun 2026
Shareholding Compare (%holding)
Promoters
3.7194
Held by 26 Schemes (2.03%)
Held by 130 FIIs (1.85%)
Thriveni Earthmovers Private Limited (17.77%)
Sunflag Iron And Steel Company Limited (10.66%)
12.07%
Quarterly Results Snapshot (Consolidated) - Mar'26 - YoY

YoY Growth in quarter ended Mar 2026 is 404.46% vs -23.23% in Mar 2025
YoY Growth in quarter ended Mar 2026 is 603.14% vs -27.10% in Mar 2025
Half Yearly Results Snapshot (Consolidated) - Sep'25
Growth in half year ended Sep 2025 is 59.58% vs 23.71% in Sep 2024
Growth in half year ended Sep 2025 is 41.37% vs 35.34% in Sep 2024
Nine Monthly Results Snapshot (Consolidated) - Dec'25
YoY Growth in nine months ended Dec 2025 is 103.29% vs 9.81% in Dec 2024
YoY Growth in nine months ended Dec 2025 is 81.20% vs 29.19% in Dec 2024
Annual Results Snapshot (Consolidated) - Mar'26
YoY Growth in year ended Mar 2026 is 154.61% vs 3.01% in Mar 2025
YoY Growth in year ended Mar 2026 is 152.94% vs 17.08% in Mar 2025
About Lloyds Metals & Energy Ltd

Company Coordinates


