
Compare Marksans Pharma with Similar Stocks
Stock DNA
Pharmaceuticals & Biotechnology
INR 11,621 Cr (Small Cap)
27.00
33
0.32%
-0.21
13.82%
3.70
Total Returns (Price + Dividend) 
Latest dividend: 0.8 per share ex-dividend date: Aug-01-2025
Risk Adjusted Returns v/s
Returns Beta

News
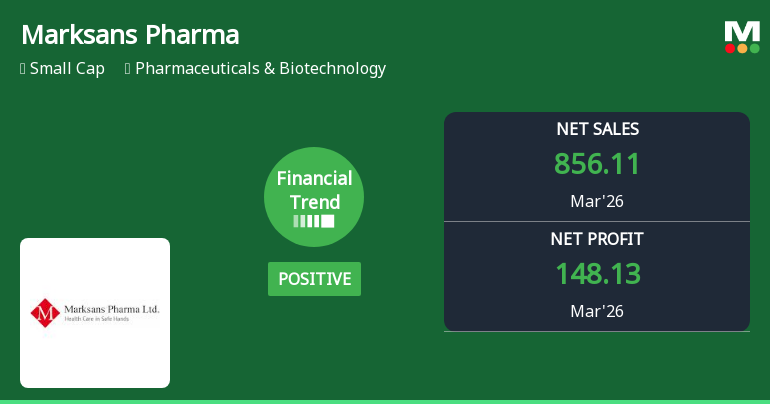
Marksans Pharma Ltd Reports Record Quarterly Performance Amid Flat Financial Trend
Marksans Pharma Ltd has delivered its strongest quarterly results to date in March 2026, posting record net sales and profitability metrics despite a shift in its financial trend from positive to flat. The pharmaceutical company’s latest performance highlights robust operational execution, though recent market sentiment has tempered its mojo grade to Hold from Buy.
Read full news article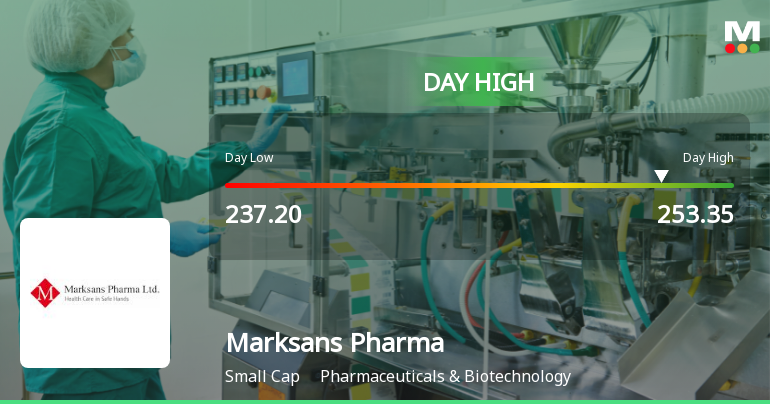
Marksans Pharma Ltd Surges 7.22% to Day's High of Rs 252.4 — Outperforms Sector by 6.02 Percentage Points
The Sensex edged up 0.55% on 09 Jun 2026, yet Marksans Pharma Ltd outpaced the broader market with a robust 7.22% gain, reaching an intraday high of Rs 252.4. This 6.02 percentage-point outperformance over its Pharmaceuticals & Biotechnology sector peers highlights a distinctly stock-specific rally rather than a market-wide lift.
Read full news article
Marksans Pharma Ltd Upgraded to Buy on Strong Financial and Technical Metrics
Marksans Pharma Ltd has been upgraded from a Hold to a Buy rating following a comprehensive reassessment of its quality, valuation, financial trends, and technical indicators. The upgrade reflects the company’s robust quarterly performance, improved management efficiency, and attractive valuation relative to its peers within the Pharmaceuticals & Biotechnology sector.
Read full news article Announcements
Marksans Pharma Limited - Other General Purpose
26-Nov-2019 | Source : NSEMarksans Pharma Limited has submitted to the Exchange a copy of disclosure of Related Party transactions under Regulation 23(9) of SEBI (Listing Obligations and Disclosure Requirements) Regulations, 2015 for the half year ended September 30, 2019.
Marksans Pharma Limited - Investor Presentation
13-Nov-2019 | Source : NSEMarksans Pharma Limited has informed the Exchange regarding Investor Presentation for second quarter September 30, 2019..
Marksans Pharma Limited - Redemption
31-Oct-2019 | Source : NSEMarksans Pharma Limited has informed the Exchange about Redemption of Unlisted 7% Redeemable Cumulative Preference Shares
Corporate Actions

No Upcoming Board Meetings

Marksans Pharma Ltd has declared 80% dividend, ex-date: 01 Aug 25

Marksans Pharma Ltd has announced 1:10 stock split, ex-date: 11 Mar 08

No Bonus history available

No Rights history available
Quality key factors
Valuation key factors
Technicals key factors
 Technical Indicator Scale: Bearish, Mildly Bearish, Sideways, Mildly Bullish, Bullish Turned
 Shareholding Snapshot : Mar 2026
Shareholding Compare (%holding)
Promoters
None
Held by 9 Schemes (4.66%)
Held by 118 FIIs (16.76%)
Mark Saldanha (43.8%)
Orbimed Asia Iv Mauritius Fvci Limited (8.62%)
28.33%
Quarterly Results Snapshot (Consolidated) - Mar'26 - QoQ

QoQ Growth in quarter ended Mar 2026 is 13.48% vs 4.72% in Dec 2025
QoQ Growth in quarter ended Mar 2026 is 30.86% vs 15.22% in Dec 2025
Half Yearly Results Snapshot (Consolidated) - Sep'25

Growth in half year ended Sep 2025 is 8.75% vs 19.52% in Sep 2024
Growth in half year ended Sep 2025 is -15.58% vs 21.88% in Sep 2024
Nine Monthly Results Snapshot (Consolidated) - Dec'25
YoY Growth in nine months ended Dec 2025 is 9.43% vs 18.36% in Dec 2024
YoY Growth in nine months ended Dec 2025 is -6.99% vs 23.20% in Dec 2024
Annual Results Snapshot (Consolidated) - Mar'26
YoY Growth in year ended Mar 2026 is 12.51% vs 20.46% in Mar 2025
YoY Growth in year ended Mar 2026 is 9.81% vs 21.32% in Mar 2025
About Marksans Pharma Ltd

Company Coordinates


