
Compare Alivus Life with Similar Stocks
Dashboard
High Management Efficiency with a high ROE of 19.43%
The company is Net-Debt Free
Poor long term growth as Net Sales has grown by an annual rate of 6.24% and Operating profit at 5.36% over the last 5 years
Flat results in Mar 26
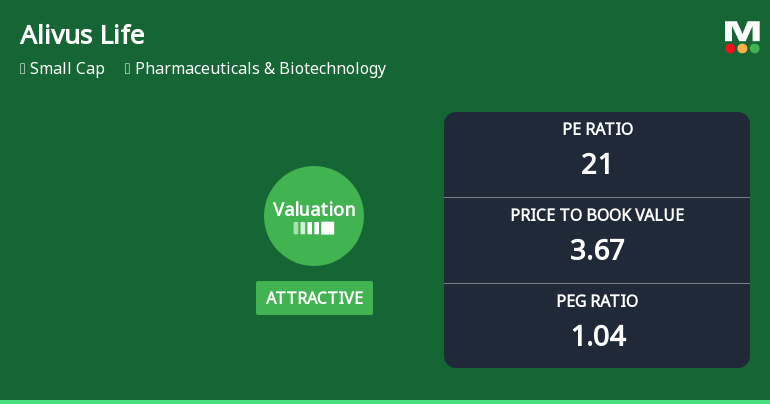
With ROE of 17.5, it has a Fair valuation with a 3.8 Price to Book Value
Majority shareholders : Promoters
Stock DNA
Pharmaceuticals & Biotechnology
INR 12,648 Cr (Small Cap)
22.00
33
0.48%
-0.22
17.52%
3.81
Total Returns (Price + Dividend) 
Latest dividend: 5 per share ex-dividend date: Sep-01-2025
Risk Adjusted Returns v/s
Returns Beta

News
Alivus Life Sciences Ltd Valuation Shifts Signal Changing Market Sentiment
Alivus Life Sciences Ltd has recently undergone a notable shift in its valuation parameters, moving from a fair to an attractive rating. This change reflects improved price metrics relative to its historical averages and peer group, signalling a potential buying opportunity for investors in the Pharmaceuticals & Biotechnology sector despite a recent downgrade in its overall Mojo Grade to Hold.
Read full news article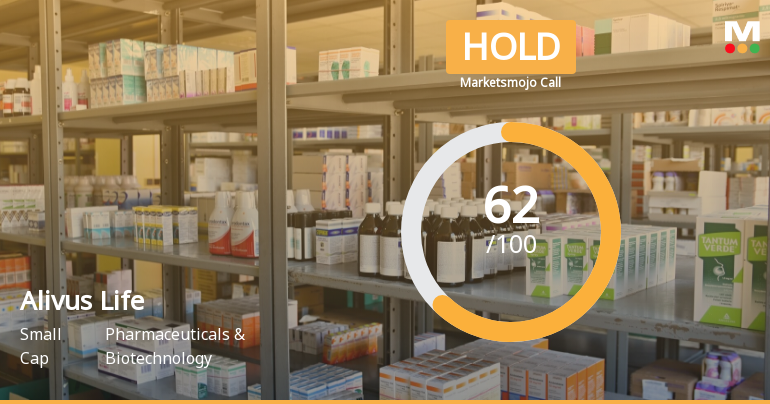
Alivus Life Sciences Ltd is Rated Hold
Alivus Life Sciences Ltd is rated 'Hold' by MarketsMOJO, with this rating last updated on 26 May 2026. However, the analysis and financial metrics presented here reflect the stock's current position as of 08 June 2026, providing investors with an up-to-date view of the company’s fundamentals, returns, and market standing.
Read full news article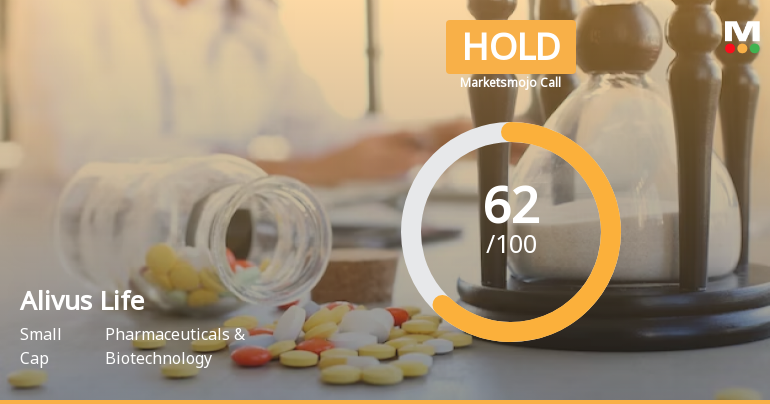
Alivus Life Sciences Ltd is Rated Hold
Alivus Life Sciences Ltd is rated 'Hold' by MarketsMOJO, with this rating last updated on 26 May 2026. However, the analysis and financial metrics discussed here reflect the stock's current position as of 08 June 2026, providing investors with an up-to-date view of the company’s fundamentals, returns, and market standing.
Read full news article Announcements
Corporate Actions

No Upcoming Board Meetings

Alivus Life Sciences Ltd has declared 250% dividend, ex-date: 01 Sep 25

No Splits history available

No Bonus history available

No Rights history available
Quality key factors
Valuation key factors
Technicals key factors
 Technical Indicator Scale: Bearish, Mildly Bearish, Sideways, Mildly Bullish, Bullish Turned
 Shareholding Snapshot : Mar 2026
Shareholding Compare (%holding)
Promoters
None
Held by 12 Schemes (5.63%)
Held by 65 FIIs (5.29%)
Nirma Limited (74.87%)
Quant Mutual Fund - Quant Small Cap Fund (2.51%)
9.87%
Quarterly Results Snapshot (Standalone) - Mar'26 - QoQ

QoQ Growth in quarter ended Mar 2026 is 2.41% vs 14.44% in Dec 2025
QoQ Growth in quarter ended Mar 2026 is 8.25% vs 15.56% in Dec 2025
Half Yearly Results Snapshot (Standalone) - Sep'25

Growth in half year ended Sep 2025 is 8.61% vs -6.67% in Sep 2024
Growth in half year ended Sep 2025 is 21.64% vs -18.64% in Sep 2024
Nine Monthly Results Snapshot (Standalone) - Dec'25
YoY Growth in nine months ended Dec 2025 is 7.22% vs -0.53% in Dec 2024
YoY Growth in nine months ended Dec 2025 is 16.89% vs -7.83% in Dec 2024
Annual Results Snapshot (Standalone) - Mar'26
YoY Growth in year ended Mar 2026 is 6.91% vs 4.54% in Mar 2025
YoY Growth in year ended Mar 2026 is 16.24% vs 3.13% in Mar 2025
About Alivus Life Sciences Ltd

Company Coordinates


