TVS Elec.

  • Market Cap: Micro Cap
  • Industry: IT - Hardware
  • ISIN: INE236G01019
  • NSEID: TVSELECT
  • BSEID: 532513
INR
523.00
57.05 (12.24%)
BSENSE

May 25

BSE+NSE Vol: 3.87 lacs

  • Price Points
  • Score
  • Mojo Parameters
  • Total Return
  • News and Corporate Actions
  • Key factors
  • Shareholding
  • Financials
  • CompanyCV
stock-summaryPrice Point
High/Low

1Day

52 Week

Valuation
Technical
Day's Volume

CASH

3.87 lacs (2,117.04%) Volume

Shareholding (Mar 2026)

FII

0.01%

Held by 2 FIIs

DII

0.03%

Held by 0 DIIs

Promoter

59.77%

Is TVS Elec. overvalued or undervalued?

09-Jun-2025

As of May 10, 2024, TVS Electronics is considered overvalued and risky, with unfavorable financial metrics such as a PE ratio of -231.51 and an EV to EBITDA of 79.37, especially when compared to peers like Redington and Tejas Networks.

As of 10 May 2024, the valuation grade for TVS Electronics has moved from very expensive to risky. The company is currently considered overvalued based on its financial metrics. Key ratios include a PE ratio of -231.51, an EV to EBITDA of 79.37, and a Price to Book Value of 9.47, which significantly exceed typical industry benchmarks.<BR><BR>In comparison to its peers, TVS Electronics' valuation metrics are starkly unfavorable. For instance, Redington has a PE ratio of 20 and an EV to EBITDA of 11.59, while Tejas Networks boasts a PE ratio of 28.73 and an EV to EBITDA of 12.26, both indicating a more attractive valuation. Despite recent strong stock performance, with a 1Y return of 75.01% compared to the Sensex's 7.62%, the underlying financial ratios suggest that TVS Electronics remains overvalued in the current market environment.

View full answer

Who are the top shareholders of the TVS Elec.?

06-Jun-2025

The top shareholders of TVS Elec. are Tvs Investments Private Limited with 59.84%, followed by individual investor Abhijit Periwal at 2.72%, and individual investors collectively owning 32.16%. Institutional investors hold a minimal stake, with mutual funds at 0.01% and foreign institutional investors at 0.03%.

The top shareholders of TVS Elec. include Tvs Investments Private Limited, which holds the largest stake at 59.84%. Other notable shareholders include individual investor Abhijit Periwal, who has a holding of 2.72%. Additionally, individual investors collectively own 32.16% of the company. The company also has a small presence of institutional investors, with mutual funds holding 0.01% across three schemes and foreign institutional investors (FIIs) holding 0.03% through four different entities. Overall, the majority of the shares are held by promoters, with no pledged promoter holdings reported.

View full answer

What does TVS Elec. do?

06-Jun-2025

TVS Electronics Ltd is a micro-cap company in the IT-Hardware industry, providing customer and technology support services. As of March 2025, it reported net sales of 115 Cr and a net profit of -1 Cr, with a market cap of Rs 866 Cr.

Overview: <BR>TVS Electronics Ltd operates in the IT - Hardware industry as a micro-cap company, focusing on customer support, technology support, and maintenance services.<BR><BR>History: <BR>TVS Electronics Limited was incorporated on September 15, 1995, originally as 'TVS eTechnology Limited', and changed its name on September 10, 2003. The latest quarterly results reported net sales and profit for the period ending March 2025.<BR><BR>Financial Snapshot: <BR>- Net Sales: 115 Cr (Quarterly Results - Mar 2025) <BR>- Net Profit: -1 Cr (Quarterly Results - Mar 2025) <BR>- Market cap: Rs 866 Cr (Micro Cap) <BR><BR>Key Metrics: <BR>- P/E: N/A <BR>- Industry P/E: 27 <BR>- Dividend Yield: 0.25% <BR>- Debt Equity: 0.33 <BR>- Return on Equity: -4.09% <BR>- Price to Book: 7.88 <BR><BR>Contact Details: <BR>Address: 249A Ambujammal Street, Off TTK Road Alowerpet Chennai Tamil Nadu : 600018 <BR>Tel: 91-44-42954800 <BR>Email: contactus@tvs-e.in <BR>Website: http://www.tvs-e.in

View full answer

Has TVS Elec. declared dividend?

06-Jun-2025

TVS Electronics Ltd has declared a 10% dividend, amounting to ₹1 per share, with an ex-date of August 2, 2024. The company has shown strong price appreciation over various periods, with total returns reaching 379.04% over the last 5 years.

TVS Electronics Ltd has declared a 10% dividend.<BR><BR>Dividend Details:<BR>- Percentage announced: 10%<BR>- Amount per share: 1 per share<BR>- Ex-date: 02 Aug 2024<BR><BR>Dividend Yield: 0.25%.<BR><BR>Total Returns by Period:<BR>In the last 6 months, the price return was 23.37%, with a dividend return of 0%, resulting in a total return of 23.37%.<BR><BR>Over the past year, the price return was 43.84%, with a dividend return of 0.31%, leading to a total return of 44.15%.<BR><BR>In the 2-year period, the price return was 24.4%, the dividend return was 0.74%, giving a total return of 25.14%.<BR><BR>For the 3-year period, the price return was 105.38%, with a dividend return of 1.63%, resulting in a total return of 107.01%.<BR><BR>In the last 4 years, the price return was 190.34%, the dividend return was 3.06%, leading to a total return of 193.4%.<BR><BR>Over the 5-year period, the price return was 374.08%, with a dividend return of 4.96%, resulting in a total return of 379.04%.<BR><BR>Overall, TVS Electronics Ltd has declared a dividend, which contributes to a modest dividend yield. The total returns over various periods indicate strong price appreciation, particularly over the longer term, reflecting positive performance in the company's stock.

View full answer

Who are the peers of the TVS Elec.?

03-Jun-2025

TVS Elec.'s peers include Bharat Global, NELCO, Rashi Peripheral, D-Link India, HCL Infosystems, DC Infotech, Vintron Info., B C C Fuba India, Panache Digilife, and E2E Networks. TVS Elec. has an average management risk and growth, with a strong capital structure, and a 1-year return of 28.13%.

Peers: The peers of TVS Elec. are Bharat Global, NELCO, Rashi Peripheral, D-Link India, HCL Infosystems, DC Infotech, Vintron Info., B C C Fuba India, Panache Digilife, and E2E Networks.<BR><BR>Quality Snapshot: Excellent management risk is observed at DC Infotech and Vintron Info., while Average management risk is found at NELCO, Rashi Peripheral, D-Link India, and TVS Elec., and Below Average management risk is noted at HCL Infosystems and Panache Digilife. Good growth is seen at Rashi Peripheral, DC Infotech, and Vintron Info., while Average growth is present at D-Link India and TVS Elec., and Below Average growth is noted at NELCO, HCL Infosystems, and Panache Digilife. Excellent capital structure is attributed to D-Link India and TVS Elec., while Good capital structure is found at NELCO, DC Infotech, and the rest have Average or Below Average capital structures.<BR><BR>Return Snapshot: B C C Fuba India has the highest 1-year return at 99.12%, while Bharat Global has the lowest at -7.05%. TVS Elec.'s 1-year return of 28.13% is significantly higher than Bharat Global's. Additionally, the six-month returns are negative for Bharat Global, NELCO, HCL Infosystems, Vintron Info., and Panache Digilife.

View full answer

Who are in the management team of TVS Elec.?

16-Jul-2025

As of March 2023, the management team of TVS Elec. includes Gopal Srinivasan (Chairman), SRILALITHA GOPAL (Managing Director), and several non-executive and independent directors, along with K Santosh as Company Secretary. This diverse team offers a wide range of expertise to the company.

As of March 2023, the management team of TVS Elec. includes the following individuals:<BR><BR>1. Gopal Srinivasan - Chairman (Non-Executive)<BR>2. SRILALITHA GOPAL - Managing Director<BR>3. M Lakshminarayan - Non-Executive & Independent Director<BR>4. M F Farooqui - Non-Executive & Independent Director<BR>5. R S Raghavan - Non-Executive & Non-Independent Director<BR>6. BALAKRISHNAN KAVIKKAL - Non-Executive & Independent Director<BR>7. Venkataramani Sumantran - Non-Executive & Independent Director<BR>8. SUBHASRI SRIRAM - Non-Executive & Independent Director<BR>9. K Santosh - Company Secretary & Compliance Officer<BR><BR>This diverse team brings a range of expertise to the company.

View full answer

How big is TVS Elec.?

24-Jul-2025

As of 24th July, TVS Electronics Ltd has a market capitalization of 792.00 Cr, with net sales of 430.26 Cr and a net loss of 3.80 Cr over the latest four quarters. Shareholder's funds were 86.98 Cr, and total assets were 164.72 Cr as of March 2019.

As of 24th July, TVS Electronics Ltd has a market capitalization of 792.00 Cr, which categorizes it as a Micro Cap company.<BR><BR>In the latest four quarters, the company reported net sales of 430.26 Cr. However, it experienced a loss of 3.80 Cr in net profit during the same period.<BR><BR>The latest annual period for the balance sheet is March 2019, where the shareholder's funds amounted to 86.98 Cr, and total assets were reported at 164.72 Cr.

View full answer

How has been the historical performance of TVS Elec.?

21-Nov-2025

TVS Elec. has experienced significant fluctuations in financial performance, with a notable decline in net sales, profits, and cash flow from Mar'18 to Mar'19. Key metrics such as operating profit and earnings per share also decreased during this period.

Answer:<BR>The historical performance of TVS Elec. shows significant fluctuations in key financial metrics over the years.<BR><BR>Breakdown:<BR>TVS Elec. experienced a notable decline in net sales from Mar'18 to Mar'19, dropping from 4,112.78 Cr to 2,760.71 Cr, following a previous increase from 2,527.07 Cr in Mar'17. Total operating income mirrored this trend, decreasing from 4,113.34 Cr in Mar'18 to 2,760.71 Cr in Mar'19. The company’s operating profit (PBDIT) also fell from 25.54 Cr in Mar'18 to 19.79 Cr in Mar'19, while profit before tax decreased from 23.20 Cr to 15.61 Cr in the same period. Profit after tax followed suit, declining from 15.00 Cr to 8.83 Cr. The earnings per share (EPS) also dropped from 8.68 to 5.29. On the balance sheet, total liabilities decreased significantly from 1,033.99 Cr in Mar'18 to 164.72 Cr in Mar'19, while total assets also fell from 1,033.99 Cr to 164.72 Cr. The company’s cash flow from operating activities turned negative in Mar'19 at -7.00 Cr, contrasting with a positive cash flow of 37.73 Cr in Mar'18. Overall, TVS Elec. has shown a volatile financial performance with significant reductions in sales, profits, and cash flow in the latest fiscal year.

View full answer

Is TVS Elec. technically bullish or bearish?

24-Nov-2025

As of November 21, 2025, TVS Elec. shows a mildly bullish trend supported by bullish MACD and KST indicators, although the RSI and Dow Theory provide no strong signals.

As of 21 November 2025, the technical trend for TVS Elec. has changed from bullish to mildly bullish. The weekly MACD and KST indicators are bullish, supporting a positive outlook, while the daily moving averages also indicate a mildly bullish stance. However, the RSI shows no signal on both weekly and monthly time frames, and Dow Theory indicates no trend. The Bollinger Bands are mildly bullish on both weekly and monthly time frames. Overall, the current technical stance is mildly bullish, driven primarily by the bullish MACD and KST indicators, despite the lack of strong signals from the RSI and Dow Theory.

View full answer

When is the next results date for TVS Electronics Ltd?

07-May-2026

The next results date for TVS Electronics Ltd is 22 May 2026.

The next results date for TVS Electronics Ltd is scheduled for 22 May 2026.

View full answer

Are TVS Electronics Ltd latest results good or bad?

23-May-2026

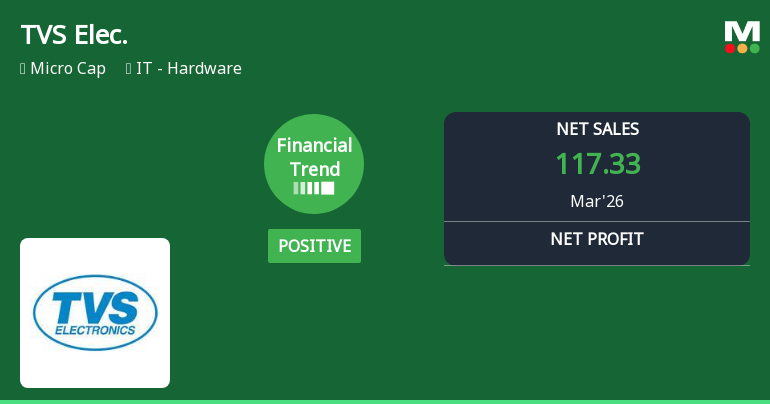
TVS Electronics Ltd's latest Q4 FY26 results show a positive turnaround with a net profit of ₹2.85 crores, marking the first profit after four quarters of losses, and improved operating margins. However, concerns about low return on equity and high stock valuation suggest investors should remain cautiously optimistic about the sustainability of this performance.

TVS Electronics Ltd's latest results for Q4 FY26 indicate a positive turnaround. The company reported a net profit of ₹2.85 crores, a significant recovery from a loss of ₹0.57 crores in the same quarter last year. This marks a crucial inflection point, as it is the first profit after four consecutive quarters of losses.<BR><BR>Additionally, the revenue showed a modest growth of 3.36% quarter-on-quarter, reaching ₹117.33 crores, and a year-on-year increase of 2.46%. The operating margin also improved to 5.96%, the highest in seven quarters, reflecting better cost management and operational efficiency.<BR><BR>However, while these results are encouraging, there are underlying concerns. The company's return on equity (ROE) remains below the peer average at 8.08%, and a significant portion of the profit was supported by other income, which raises questions about the sustainability of this profitability. The stock's valuation is considered risky, trading at a high price-to-book value of 9.57 times, which may not be justified given the operational challenges.<BR><BR>In summary, while the latest results are good in terms of returning to profitability and improving margins, the company still faces structural issues that could impact its future performance. Investors should approach with cautious optimism, keeping an eye on the sustainability of this turnaround.

View full answer

Should I buy, sell or hold TVS Electronics Ltd?

23-May-2026

Why is TVS Electronics Ltd falling/rising?

25-May-2026

As of 24-May, TVS Electronics Ltd's stock price is rising to 465.25, reflecting a 1.65% increase. This rise is driven by strong relative performance, a trend reversal after previous declines, and robust annual growth, despite a decrease in investor participation.

As of 24-May, TVS Electronics Ltd's stock price is rising, currently at 465.25, reflecting a change of 7.55 (1.65%) upward. This increase can be attributed to several factors. Firstly, the stock has outperformed its sector by 1.89% today, indicating strong relative performance. Additionally, it has experienced a trend reversal, gaining after two consecutive days of decline, which may have encouraged investor confidence.<BR><BR>The stock opened with a significant gain of 3.67% today and reached an intraday high of Rs 479.9, showcasing positive momentum. Furthermore, over the year, the stock has shown a robust performance with a 16.37% increase, contrasting sharply with the Sensex, which has declined by 6.84% over the same period. This long-term performance may also contribute to the current rise in stock price.<BR><BR>However, it is important to note that there has been a decrease in investor participation, with delivery volume falling by 33.75% against the 5-day average. Despite this, the stock remains liquid enough for trading, which suggests that while there may be some caution among investors, the overall upward movement in price is supported by recent gains and strong historical performance.

View full answer
iScoreScore
Click here to find our call on this stock
Strong Sell
Sell
Hold
Buy
Strong Buy

Dashboard

1

Strong ability to service debt as the company has a low Debt to EBITDA ratio of 5.36 times

 
2

Poor long term growth as Operating profit has grown by an annual rate 12.93% of over the last 5 years

 
3

Positive results in Mar 26

4

Risky - Negative Operating Profits

5

Despite the size of the company, domestic mutual funds hold only 0.02% of the company

6

Market Beating performance in long term as well as near term

stock-summaryMojo Parameters

Mojo Parameters

Loading Valuation Snapshot...

Stock DNA

stock-summary
Industry

IT - Hardware

stock-summary
Market cap

INR 975 Cr (Micro Cap)

stock-summary
P/E

NA (Loss Making)

stock-summary
Industry P/E

28

stock-summary
Dividend Yield

0.00%

stock-summary
Debt Equity

0.57

stock-summary
Return on Equity

-1.56%

stock-summary
Price to Book

9.57

Revenue and Profits:
Net Sales:
117 Cr
(Quarterly Results - Mar 2026)
Net Profit:
3 Cr
stock-summaryTotal Returns
Total Returns (Price + Dividend) stock-summary
Dividend Yield (0%)
TimePeriod
Price Return
Dividend Return
Total Return
3 Months
40.88%
0%
40.88%
6 Months
-5.14%
0%
-5.14%
1 Year
32.05%
0%
32.05%
2 Years
66.43%
0.34%
66.77%
3 Years
49.94%
0.81%
50.75%
4 Years
156.81%
1.55%
158.36%
5 Years
239.17%
3.15%
242.32%

Latest dividend: 1 per share ex-dividend date: Aug-02-2024

Risk Adjusted Returns v/s stock-summary
Returns Beta
Icon
Beta has not been calculated since enough price history is not available
stock-summaryNews & Corporate Actions

News

TVS Electronics Gains 0.71%: Mixed Momentum and Q4 Profitability Highlight Week

Announcements stock-summary

TVS Electronics Limited - Other General Purpose

18-Nov-2019 | Source : NSE

TVS Electronics Limited has submitted to the Exchange a copy of Disclosure on Related Party Transactions for the half year ended September 30, 2019 pursuant to Regulation 23(9) of the

TVS Electronics Limited - Updates

13-Nov-2019 | Source : NSE

TVS Electronics Limited has informed the Exchange regarding 'Submission of Newspaper publication of Unaudited Financial Results for the quarter ended 30th September 2019'.

Price movement

18-Sep-2019 | Source : NSE

Significant movement in price has been observed in TVS Electronics Limited. The Exchange, in order to ensure that investors have latest relevant information about the company and to inform the market place so that the interest of the investors is safeguarded, had written to the company. TVS Electronics Limited has submitted their response.

Corporate Actions stock-summary

stock-summary
BOARD MEETING

No Upcoming Board Meetings

stock-summary
DIVIDEND

TVS Electronics Ltd has declared 10% dividend, ex-date: 02 Aug 24

stock-summary
SPLITS

No Splits history available

stock-summary
BONUS

No Bonus history available

stock-summary
RIGHTS

No Rights history available

stock-summaryKey Factors

Quality key factors stock-summary

Factor
Value
Sales Growth (5y)
17.08%
EBIT Growth (5y)
12.93%
EBIT to Interest (avg)
6.16
Debt to EBITDA (avg)
1.93
Net Debt to Equity (avg)
0.57
Sales to Capital Employed (avg)
2.83
Tax Ratio
58.46%
Dividend Payout Ratio
0
Pledged Shares
0
Institutional Holding
0.04%
ROCE (avg)
2.79%
ROE (avg)
8.08%

Valuation key factors

Factor
Value
P/E Ratio
NA (Loss Making)
Industry P/E
28
Price to Book Value
9.57
EV to EBIT
-558.09
EV to EBITDA
60.95
EV to Capital Employed
6.44
EV to Sales
2.05
PEG Ratio
NA
Dividend Yield
NA
ROCE (Latest)
-3.38%
ROE (Latest)
-1.56%

Technicals key factors

Indicator
Weekly
Monthly
MACD
Bullish
Mildly Bearish
RSI
No Signal
No Signal
Bollinger Bands
Bullish
Bullish
Moving Averages
Mildly Bearish (Daily)
KST
Bullish
Bullish
Dow Theory
Mildly Bearish
Mildly Bullish
OBV
Bullish
Bullish
stock-summary Technical Indicator Scale: Bearish, Mildly Bearish, Sideways, Mildly Bullish, Bullish  Turned 
stock-summaryShareholding
Shareholding Snapshot : Mar 2026stock-summary
Shareholding Compare (%holding) stock-summary
Majority shareholders

Promoters

Pledged Promoter Holdings

None

Mutual Funds

Held by 3 Schemes (0.01%)

FIIs

Held by 2 FIIs (0.01%)

Promoter with highest holding

Gopal Srinivasan (59.71%)

Highest Public shareholder

Abhijit Periwal (2.23%)

Individual Investors Holdings

31.91%

stock-summaryFinancial
[
  {
    "link": "quarterly",
    "btn_text": "All Quarterly Results",
    "header": "Quarterly Results Snapshot (Standalone) - Mar'26 - QoQ",
    "rhs": [
      {
        "prefix": "Net Sales ",
        "suffix": "QoQ Growth in quarter ended Mar 2026 is 3.36% vs -10.90% in Dec 2025",
        "dir": 1
      },
      {
        "prefix": "Standalone Net Profit ",
        "suffix": "QoQ Growth in quarter ended Mar 2026 is 595.12% vs -73.55% in Dec 2025",
        "dir": 1
      }
    ],
    "table": {
      "header": [
        "Mar'26",
        "Dec'25",
        "Change(%)"
      ],
      "body": [
        {
          "field": "Net Sales",
          "val1": "117.33",
          "val2": "113.52",
          "chgp": "3.36%",
          "chgp_class": "positive"
        },
        {
          "field": "Operating Profit (PBDIT) excl Other Income",
          "val1": "6.99",
          "val2": "6.53",
          "chgp": "7.04%",
          "chgp_class": "positive"
        },
        {
          "field": "Interest",
          "val1": "1.98",
          "val2": "1.54",
          "chgp": "28.57%",
          "chgp_class": "negative"
        },
        {
          "field": "Exceptional Items",
          "val1": "0.00",
          "val2": "-0.74",
          "chgp": "100.00%",
          "chgp_class": "positive"
        },
        {
          "field": "Standalone Net Profit",
          "val1": "2.85",
          "val2": "0.41",
          "chgp": "595.12%",
          "chgp_class": "positive"
        },
        {
          "field": "Operating Profit Margin (Excl OI)",
          "val1": "5.96%",
          "val2": "5.75%",
          "chgp": "0.21%",
          "chgp_class": "positive"
        }
      ]
    }
  },
  {
    "link": "half-yearly",
    "btn_text": "All Half Yearly Results",
    "header": "Half Yearly Results Snapshot (Standalone) - Sep'25",
    "rhs": [
      {
        "prefix": "Net Sales ",
        "suffix": " Growth in half year ended Sep 2025 is 3.79% vs 18.80% in Sep 2024",
        "dir": -1
      },
      {
        "prefix": "Standalone Net Profit ",
        "suffix": " Growth in half year ended Sep 2025 is 22.48% vs -279.17% in Sep 2024",
        "dir": 1
      }
    ],
    "table": {
      "header": [
        "Sep'25",
        "Sep'24",
        "Change(%)"
      ],
      "body": [
        {
          "field": "Net Sales",
          "val1": "224.07",
          "val2": "215.88",
          "chgp": "3.79%",
          "chgp_class": "positive"
        },
        {
          "field": "Operating Profit (PBDIT) excl Other Income",
          "val1": "6.03",
          "val2": "5.79",
          "chgp": "4.15%",
          "chgp_class": "positive"
        },
        {
          "field": "Interest",
          "val1": "3.37",
          "val2": "2.66",
          "chgp": "26.69%",
          "chgp_class": "negative"
        },
        {
          "field": "Exceptional Items",
          "val1": "0.00",
          "val2": "0.00",
          "chgp": "",
          "chgp_class": "neutral"
        },
        {
          "field": "Standalone Net Profit",
          "val1": "-2.00",
          "val2": "-2.58",
          "chgp": "22.48%",
          "chgp_class": "positive"
        },
        {
          "field": "Operating Profit Margin (Excl OI)",
          "val1": "2.69%",
          "val2": "2.68%",
          "chgp": "0.01%",
          "chgp_class": "positive"
        }
      ]
    }
  },
  {
    "link": "nine-monthly",
    "btn_text": "All Nine Monthly Results",
    "header": "Nine Monthly Results Snapshot (Standalone) - Dec'25",
    "rhs": [
      {
        "prefix": "Net Sales ",
        "suffix": "YoY Growth in nine months ended Dec 2025 is 6.92% vs 17.55% in Dec 2024",
        "dir": -1
      },
      {
        "prefix": "Standalone Net Profit ",
        "suffix": "YoY Growth in nine months ended Dec 2025 is 50.77% vs -976.67% in Dec 2024",
        "dir": 1
      }
    ],
    "table": {
      "header": [
        "Dec'25",
        "Dec'24",
        "Change(%)"
      ],
      "body": [
        {
          "field": "Net Sales",
          "val1": "337.59",
          "val2": "315.75",
          "chgp": "6.92%",
          "chgp_class": "positive"
        },
        {
          "field": "Operating Profit (PBDIT) excl Other Income",
          "val1": "12.56",
          "val2": "8.83",
          "chgp": "42.24%",
          "chgp_class": "positive"
        },
        {
          "field": "Interest",
          "val1": "4.91",
          "val2": "3.95",
          "chgp": "24.30%",
          "chgp_class": "negative"
        },
        {
          "field": "Exceptional Items",
          "val1": "-0.74",
          "val2": "0.00",
          "chgp": "",
          "chgp_class": "neutral"
        },
        {
          "field": "Standalone Net Profit",
          "val1": "-1.59",
          "val2": "-3.23",
          "chgp": "50.77%",
          "chgp_class": "positive"
        },
        {
          "field": "Operating Profit Margin (Excl OI)",
          "val1": "3.72%",
          "val2": "2.79%",
          "chgp": "0.93%",
          "chgp_class": "positive"
        }
      ]
    }
  },
  {
    "link": "annual",
    "btn_text": "All Annual Results",
    "header": "Annual Results Snapshot (Standalone) - Mar'26",
    "rhs": [
      {
        "prefix": "Net Sales ",
        "suffix": "YoY Growth in year ended Mar 2026 is 5.73% vs 17.67% in Mar 2025",
        "dir": -1
      },
      {
        "prefix": "Standalone Net Profit ",
        "suffix": "YoY Growth in year ended Mar 2026 is 133.25% vs -1,503.70% in Mar 2025",
        "dir": 1
      }
    ],
    "table": {
      "header": [
        "Mar'26",
        "Mar'25",
        "Change(%)"
      ],
      "body": [
        {
          "field": "Net Sales",
          "val1": "454.92",
          "val2": "430.26",
          "chgp": "5.73%",
          "chgp_class": "positive"
        },
        {
          "field": "Operating Profit (PBDIT) excl Other Income",
          "val1": "19.55",
          "val2": "11.48",
          "chgp": "70.30%",
          "chgp_class": "positive"
        },
        {
          "field": "Interest",
          "val1": "6.89",
          "val2": "5.36",
          "chgp": "28.54%",
          "chgp_class": "negative"
        },
        {
          "field": "Exceptional Items",
          "val1": "-0.74",
          "val2": "0.00",
          "chgp": "",
          "chgp_class": "neutral"
        },
        {
          "field": "Standalone Net Profit",
          "val1": "1.26",
          "val2": "-3.79",
          "chgp": "133.25%",
          "chgp_class": "positive"
        },
        {
          "field": "Operating Profit Margin (Excl OI)",
          "val1": "4.30%",
          "val2": "2.67%",
          "chgp": "1.63%",
          "chgp_class": "positive"
        }
      ]
    }
  }
]

Quarterly Results Snapshot (Standalone) - Mar'26 - QoQstock-summary

Mar'26
Dec'25
Change(%)
Net Sales
117.33
113.52
3.36%
Operating Profit (PBDIT) excl Other Income
6.99
6.53
7.04%
Interest
1.98
1.54
28.57%
Exceptional Items
0.00
-0.74
100.00%
Standalone Net Profit
2.85
0.41
595.12%
Operating Profit Margin (Excl OI)
5.96%
5.75%
0.21%
Values in Rs Cr.
Direction Arrows
Net Sales

QoQ Growth in quarter ended Mar 2026 is 3.36% vs -10.90% in Dec 2025

Direction Arrows
Standalone Net Profit

QoQ Growth in quarter ended Mar 2026 is 595.12% vs -73.55% in Dec 2025

Half Yearly Results Snapshot (Standalone) - Sep'25stock-summary

Sep'25
Sep'24
Change(%)
Net Sales
224.07
215.88
3.79%
Operating Profit (PBDIT) excl Other Income
6.03
5.79
4.15%
Interest
3.37
2.66
26.69%
Exceptional Items
0.00
0.00
Standalone Net Profit
-2.00
-2.58
22.48%
Operating Profit Margin (Excl OI)
2.69%
2.68%
0.01%
Values in Rs Cr.
Direction Arrows
Net Sales

Growth in half year ended Sep 2025 is 3.79% vs 18.80% in Sep 2024

Direction Arrows
Standalone Net Profit

Growth in half year ended Sep 2025 is 22.48% vs -279.17% in Sep 2024

Nine Monthly Results Snapshot (Standalone) - Dec'25stock-summary

Dec'25
Dec'24
Change(%)
Net Sales
337.59
315.75
6.92%
Operating Profit (PBDIT) excl Other Income
12.56
8.83
42.24%
Interest
4.91
3.95
24.30%
Exceptional Items
-0.74
0.00
Standalone Net Profit
-1.59
-3.23
50.77%
Operating Profit Margin (Excl OI)
3.72%
2.79%
0.93%
Values in Rs Cr.
Direction Arrows
Net Sales

YoY Growth in nine months ended Dec 2025 is 6.92% vs 17.55% in Dec 2024

Direction Arrows
Standalone Net Profit

YoY Growth in nine months ended Dec 2025 is 50.77% vs -976.67% in Dec 2024

Annual Results Snapshot (Standalone) - Mar'26stock-summary

Mar'26
Mar'25
Change(%)
Net Sales
454.92
430.26
5.73%
Operating Profit (PBDIT) excl Other Income
19.55
11.48
70.30%
Interest
6.89
5.36
28.54%
Exceptional Items
-0.74
0.00
Standalone Net Profit
1.26
-3.79
133.25%
Operating Profit Margin (Excl OI)
4.30%
2.67%
1.63%
Values in Rs Cr.
Direction Arrows
Net Sales

YoY Growth in year ended Mar 2026 is 5.73% vs 17.67% in Mar 2025

Direction Arrows
Standalone Net Profit

YoY Growth in year ended Mar 2026 is 133.25% vs -1,503.70% in Mar 2025

stock-summaryCompany CV
About TVS Electronics Ltd stock-summary
stock-summary
TVS Electronics Ltd
Micro Cap
IT - Hardware
TVS Electronics Limited was formerly incorporated as 'TVS eTechnology Limited' on September 15, 1995. The Company changed their name from TVS eTechnology Limited to TVS Electronics Limited on September 10, 2003. Initially, the company was a national player in the customer support, technology support and maintenance services (TMS) areas. They offered field customer support to products of TVS-E.
Company Coordinates stock-summary
Company Details
249A Ambujammal Street, Off TTK Road Alowerpet Chennai Tamil Nadu : 600018
stock-summary
Tel: 91-44-42954800
stock-summary
contactus@tvs-e.in
Registrar Details
Sundaram-Clayton Ltd , Jayalakshmi Estates, 5th Floor, No 29 (Old 8), Post Box No. 732, Haddows Road, Chennai