
Compare Vardhman Hold. with Similar Stocks
Dashboard
With a Operating Losses, the company has a Weak Long Term Fundamental Strength
- Poor long term growth as Net Sales has grown by an annual rate of -9.16% and Operating profit at -8.45%
The company has declared Negative results for the last 3 consecutive quarters
Despite the size of the company, domestic mutual funds hold only 0.23% of the company
Stock DNA
Non Banking Financial Company (NBFC)
INR 1,167 Cr (Micro Cap)
6.00
21
0.13%
0.00
5.74%
0.32
Total Returns (Price + Dividend) 
Latest dividend: 5 per share ex-dividend date: Sep-12-2025
Risk Adjusted Returns v/s
Returns Beta

News
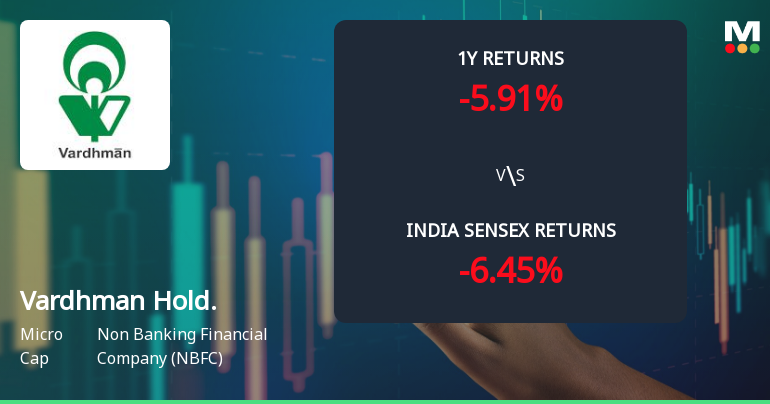
Vardhman Holdings Ltd Technical Momentum Shifts Amid Mixed Market Signals
Vardhman Holdings Ltd, a micro-cap player in the Non Banking Financial Company (NBFC) sector, has experienced a notable shift in its technical momentum, moving from a mildly bearish stance to a sideways trend. Despite a modest daily gain of 1.33%, the stock’s technical indicators present a complex picture, with bullish signals on weekly charts contrasting with mild bearishness on monthly and daily timeframes. This article analyses the recent technical developments, price momentum, and relative performance against the Sensex to provide a comprehensive view for investors.
Read full news article
Vardhman Holdings Ltd is Rated Strong Sell
Vardhman Holdings Ltd is rated Strong Sell by MarketsMOJO, with this rating last updated on 25 Nov 2025. However, the analysis and financial metrics discussed here reflect the company’s current position as of 20 June 2026, providing investors with an up-to-date view of its fundamentals, valuation, financial trends, and technical outlook.
Read full news article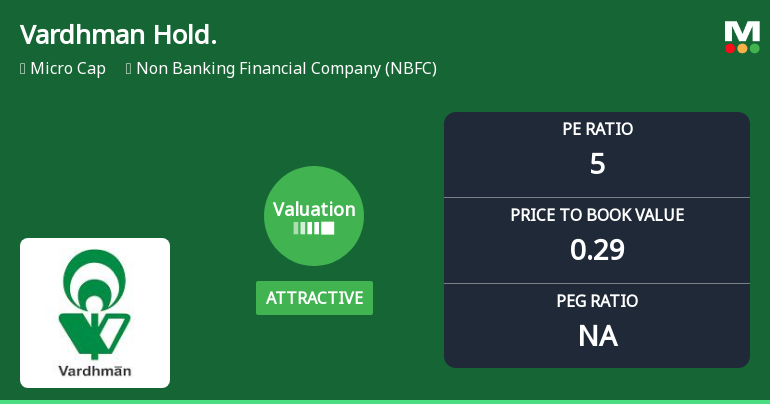
Vardhman Holdings Ltd Valuation Shifts Signal Renewed Price Attractiveness
Vardhman Holdings Ltd, a micro-cap player in the Non Banking Financial Company (NBFC) sector, has seen its valuation parameters shift notably, moving from a very attractive to an attractive rating. This change reflects evolving market perceptions amid mixed financial metrics and a challenging sector backdrop, prompting a reassessment of its price attractiveness relative to peers and historical benchmarks.
Read full news article Announcements
Vardhman Holdings Limited - Updates
05-Dec-2019 | Source : NSEVardhman Holdings Limited has informed the Exchange regarding 'Share Dematerialised during the month ended 30th November, 2019'.
Updates
10-Sep-2019 | Source : NSE
| Vardhman Holdings Limited has informed the Exchange regarding 'Shares dematerialized during the month ended 31st August, 2019.'. |
Shareholders meeting
06-Sep-2019 | Source : NSE
| Vardhman Holdings Limited has informed the Exchange regarding Notice of Annual General Meeting to be held on September 30, 2019 |
Corporate Actions

No Upcoming Board Meetings

Vardhman Holdings Ltd has declared 50% dividend, ex-date: 12 Sep 25

No Splits history available

No Bonus history available

No Rights history available
Quality key factors
Valuation key factors
Technicals key factors
 Technical Indicator Scale: Bearish, Mildly Bearish, Sideways, Mildly Bullish, Bullish Turned
 Shareholding Snapshot : Mar 2026
Shareholding Compare (%holding)
Promoters
None
Held by 1 Schemes (0.06%)
Held by 7 FIIs (0.05%)
Devakar Investment And Trading Company Private Limited (34.29%)
Anil Kumar Goel (4.79%)
19.87%
Quarterly Results Snapshot (Consolidated) - Mar'26 - YoY

YoY Growth in quarter ended Mar 2026 is -85.00% vs 3,042.86% in Mar 2025
YoY Growth in quarter ended Mar 2026 is -23.10% vs 172.60% in Mar 2025
Half Yearly Results Snapshot (Consolidated) - Sep'25

Growth in half year ended Sep 2025 is -56.00% vs -61.29% in Sep 2024
Growth in half year ended Sep 2025 is -11.27% vs 15.87% in Sep 2024
Nine Monthly Results Snapshot (Consolidated) - Dec'25
YoY Growth in nine months ended Dec 2025 is -42.05% vs -53.14% in Dec 2024
YoY Growth in nine months ended Dec 2025 is -13.74% vs 18.16% in Dec 2024
Annual Results Snapshot (Consolidated) - Mar'26
YoY Growth in year ended Mar 2026 is -46.20% vs 52.82% in Mar 2025
YoY Growth in year ended Mar 2026 is -16.28% vs 39.56% in Mar 2025
About Vardhman Holdings Ltd

Company Coordinates


