
Key Events This Week
1 June: Q4 FY26 results reveal 47% profit plunge despite revenue surge
2 June: Mixed quarterly results amid strong long-term returns reported
5 June: Stock rallies 11.37% on heavy volume, closing at Rs.1,094.40
Jun 23, 12:03 PM
BSE+NSE Vol: 2.84 k
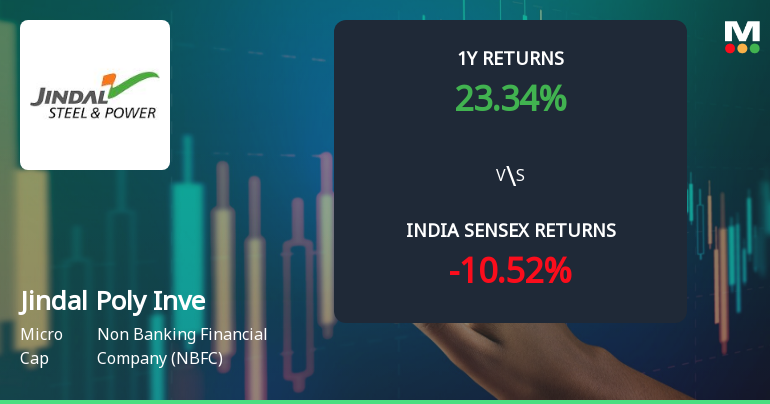
Non Banking Financial Company (NBFC)
INR 1,170 Cr (Micro Cap)
1.00
21
0.00%
0.01
53.43%
0.73
Jindal Poly Inve for the last several years.


Jindal Poly Investment & Finance Company Ltd is rated 'Buy' by MarketsMOJO, with this rating last updated on 13 April 2026. However, the analysis and financial metrics discussed here reflect the stock's current position as of 20 June 2026, providing investors with the latest insights into its performance and outlook.
Read full news article
1 June: Q4 FY26 results reveal 47% profit plunge despite revenue surge
2 June: Mixed quarterly results amid strong long-term returns reported
5 June: Stock rallies 11.37% on heavy volume, closing at Rs.1,094.40
Jindal Poly Investment & Finance Company Ltd, a micro-cap player in the Non Banking Financial Company (NBFC) sector, has experienced a notable shift in its technical momentum, reflecting a transition from a bullish to a mildly bullish trend. Despite a recent 4.00% decline in its share price to ₹1,060.70, the stock continues to demonstrate resilience with mixed signals from key technical indicators such as MACD, RSI, Bollinger Bands, and moving averages, warranting a closer examination of its price dynamics and market positioning.
Read full news articleJindal Poly Investment and Finance Company Limited has informed the Exchange regarding disclosure of Related Party Transactions for the half year ended 30th September, 2019
Jindal Poly Investment and Finance Company Limited has informed the Exchange regarding 'Certificate under Regulation 74(5) of the SEBl (Depositories and Participants) Regulations, 2018 for the Quarter Ended 30th September, 2019'.
| Jindal Poly Investment and Finance Company Limited has informed the Exchange regarding a press release dated September 05, 2019, titled "NOTICE OF 7th ANNUAL GENERAL MEETING". |

No Upcoming Board Meetings

No Dividend history available

No Splits history available

No Bonus history available

No Rights history available
 Technical Indicator Scale: Bearish, Mildly Bearish, Sideways, Mildly Bullish, Bullish Turned
 Promoters
None
Held by 0 Schemes
Held by 6 FIIs (0.19%)
Futuristic Trust(formerly Known As Ssj Trust) (50.99%)
Anita Bubna . (1.94%)
17.99%

YoY Growth in quarter ended Mar 2026 is 503.83% vs -43.18% in Mar 2025

YoY Growth in quarter ended Mar 2026 is -47.25% vs -32.33% in Mar 2025
Growth in half year ended Sep 2025 is 70.98% vs 8.29% in Sep 2024
Growth in half year ended Sep 2025 is -38.54% vs 103.84% in Sep 2024
YoY Growth in nine months ended Dec 2025 is 4,046.10% vs 7.14% in Dec 2024
YoY Growth in nine months ended Dec 2025 is 258.82% vs 16.29% in Dec 2024
YoY Growth in year ended Mar 2026 is 3,170.87% vs -12.09% in Mar 2025
YoY Growth in year ended Mar 2026 is 189.86% vs 0.09% in Mar 2025


