GeeCee Vent.

  • Market Cap: Micro Cap
  • Industry: Realty
  • ISIN: INE916G01016
  • NSEID: GEECEE
  • BSEID: 532764
INR
351.15
-2.1 (-0.59%)
BSENSE

Dec 05

BSE+NSE Vol: 4.66 k

  • Price Points
  • Score
  • Mojo Parameters
  • Total Return
  • News and Corporate Actions
  • Key factors
  • Shareholding
  • Financials
  • CompanyCV
stock-summaryPrice Point
High/Low

1Day

52 Week

Valuation
Technical
Day's Volume

CASH

4.66 k (327.68%) Volume

Shareholding (Sep 2025)

FII

0.01%

Held by 1 FIIs

DII

0.11%

Held by 0 DIIs

Promoter

67.71%

Who are the top shareholders of the GeeCee Vent.?

06-Jun-2025

The top shareholders of GeeCee Vent include Meena A Kothari, who holds 20.56%, and Minix Holdings Pvt Ltd, which owns 4.85%. Individual investors collectively hold 22.82%, while a foreign institutional investor has a 0.03% stake, with no mutual funds currently invested.

The top shareholders of GeeCee Vent include the promoters, who hold the majority of the shares. The promoter with the highest holding is Meena A Kothari, owning 20.56% of the company. In terms of public shareholders, Minix Holdings Pvt Ltd is the largest, holding 4.85%. Additionally, individual investors collectively hold 22.82% of the shares, while there is one foreign institutional investor (FII) that holds a small stake of 0.03%. There are no mutual funds currently holding shares in the company.

Read More

Who are in the management team of GeeCee Vent.?

06-Jun-2025

As of March 2022, the management team of GeeCee Vent includes Ashwin Kumar Kothari (Chairman), Harisingh Shyamsukha, Gaurav Shyamsukha, V V Sureshkumar (Whole Time Executive Directors), and several Independent Non-Executive Directors, including Rakesh Khanna, Suresh Tapuriah, Vallabh Prasad Biyani, Rupal Vora, and Neha Bandyopadhyay. The team combines executive and non-executive roles to guide the company's governance and strategy.

As of March 2022, the management team of GeeCee Vent includes the following individuals:<BR><BR>1. Ashwin Kumar Kothari - Chairman & Non Executive Director<BR>2. Harisingh Shyamsukha - Whole Time Executive Director<BR>3. Gaurav Shyamsukha - Whole Time Executive Director<BR>4. Rohit Kothari - Non-Executive & Non-Independent Director<BR>5. V V Sureshkumar - Whole Time Executive Director<BR>6. Rakesh Khanna - Independent Non-Executive Director<BR>7. Suresh Tapuriah - Independent Non-Executive Director<BR>8. Vallabh Prasad Biyani - Independent Non-Executive Director<BR>9. Rupal Vora - Independent Non-Executive Director<BR>10. Neha Bandyopadhyay - Independent Non-Executive Director<BR><BR>This team comprises a mix of executive and non-executive directors, contributing to the governance and strategic direction of the company.

Read More

When is the next results date for GeeCee Vent.?

06-Jun-2025

No Upcoming Board Meetings

Has GeeCee Vent. declared dividend?

06-Jun-2025

GeeCee Ventures Ltd has declared a 20% dividend, amounting to ₹2 per share, with an ex-date of September 4, 2024. Despite recent volatility, the company has shown strong total returns over longer periods, particularly a 428.54% total return over the past 5 years.

Geecee Ventures Ltd has declared a 20% dividend.<BR><BR>Dividend Details:<BR>- Percentage announced: 20%<BR>- Amount per share: 2<BR>- Ex-date: 04 Sep 24<BR><BR>Dividend Yield: 0.53%.<BR><BR>Total Returns by Period:<BR>In the last 6 months, the price return was -10.71%, with a dividend return of 0%, resulting in a total return of -10.71%.<BR><BR>Over the past year, the price return was 18.22%, the dividend return was 0.58%, leading to a total return of 18.8%.<BR><BR>In a 2-year period, the price return reached 149.61%, with a dividend return of 2.31%, culminating in a total return of 151.92%.<BR><BR>For the 3-year period, the price return was 201.52%, the dividend return was 3.28%, resulting in a total return of 204.8%.<BR><BR>In the last 4 years, the price return was 247.79%, with a dividend return of 3.67%, leading to a total return of 251.46%.<BR><BR>Over the past 5 years, the price return was 420.05%, with a dividend return of 8.49%, resulting in a total return of 428.54%.<BR><BR>Overall, Geecee Ventures Ltd has declared a dividend while showing positive total returns over longer periods, particularly in the 5-year span, indicating strong growth despite some recent volatility.

Read More

Who are the peers of the GeeCee Vent.?

03-Jun-2025

GeeCee Vent.'s peers include DLF, Macrotech Development, Godrej Properties, Prestige Estates, Oberoi Realty, Eldeco Housing, Hampton Sky, Suratwwala Business, and PVP Ventures. Management risk and growth vary among peers, with Macrotech and Oberoi showing excellent metrics, while GeeCee Vent. has average ratings; its 1-year return is 18.50%, outperforming Suratwwala Business's -66.03%.

Peers: The peers of GeeCee Vent. are DLF, Macrotech Devel., Godrej Propert., Prestige Estates, Oberoi Realty, Eldeco Housing, Hampton Sky, Suratwwala Busi., and PVP Ventures.<BR><BR>Quality Snapshot: Excellent management risk is observed at Macrotech Devel. and Oberoi Realty, while Average management risk is found at DLF, Godrej Propert., Prestige Estates, GeeCee Vent., Eldeco Housing, Suratwwala Busi., and the rest. Below Average management risk is noted at Hampton Sky and PVP Ventures. Growth is Excellent at Macrotech Devel. and Oberoi Realty, while Average growth is found at DLF, GeeCee Vent., and the rest. Below Average growth is observed at Godrej Propert., Prestige Estates, Eldeco Housing, Suratwwala Busi., and PVP Ventures, with Hampton Sky showing Good growth. Capital Structure is Excellent at Oberoi Realty and GeeCee Vent., Good at DLF and Suratwwala Busi., while Below Average is noted at Macrotech Devel. and Hampton Sky, and the rest have Below Average or Average ratings.<BR><BR>Return Snapshot: The peer with the highest 1-year return is Shraddha Prime at 142.47%, while the lowest is Suratwwala Busi. at -66.03%. GeeCee Vent.'s 1-year return of 18.50% is significantly higher than that of Suratwwala Busi. Additionally, several peers, including Eldeco Housing, Hampton Sky, Suratwwala Busi., and PVP Ventures, have negative six-month returns.

Read More

Is GeeCee Vent. overvalued or undervalued?

09-Jun-2025

As of February 8, 2024, GeeCee Vent. is considered very expensive and overvalued with a PE ratio of 17.44 and an EV to EBITDA of 9.53, suggesting caution for investors despite a strong 1Y return of 17.62%.

As of 8 February 2024, the valuation grade for GeeCee Vent. has moved from risky to very expensive. The company is currently considered overvalued based on its financial metrics. Key ratios include a PE ratio of 17.44, an EV to EBITDA of 9.53, and a PEG ratio of 0.68, which indicate that the stock is priced at a premium compared to its earnings growth potential.<BR><BR>In comparison to its peers, GeeCee Vent. has a lower PE ratio than Solar Industries, which stands at 123.77, and a higher EV to EBITDA than Godrej Industries, which is at 34.36. The overall peer comparison suggests that while GeeCee Vent. is positioned within a very expensive category, it does not offer a compelling valuation relative to its industry peers. Despite a strong historical performance with a 1Y return of 17.62% compared to the Sensex's 7.65%, the current valuation indicates that investors may want to exercise caution.

Read More

What does GeeCee Vent. do?

17-Jul-2025

GeeCee Ventures Ltd is a micro-cap company in the realty industry, reporting net sales of 158 Cr and a net profit of 39 Cr for the quarter ending March 2025. It has a market cap of INR 783 Cr, a P/E ratio of 17.00, and a dividend yield of 0.55%.

Overview: <BR>GeeCee Ventures Ltd operates in the realty industry and is categorized as a micro-cap company.<BR><BR>History: <BR>GeeCee Ventures Ltd was incorporated on February 14, 1984, originally under the name Shubham Aromatics Pvt Ltd. The latest quarterly results reported net sales and net profit for the period ending March 2025.<BR><BR>Financial Snapshot: <BR>Net Sales: 158 Cr (Quarterly Results - Mar 2025) <BR>Net Profit: 39 Cr (Quarterly Results - Mar 2025) <BR>Market Cap: INR 783 Cr (Micro Cap)<BR><BR>Key Metrics: <BR>P/E: 17.00 <BR>Industry P/E: 47 <BR>Dividend Yield: 0.55% <BR>Debt Equity: -0.32 <BR>Return on Equity: 6.90% <BR>Price to Book: 1.07<BR><BR>Contact Details: <BR>Address: 209/210 Arcadia Building, 2nd Floor 195 Nariman Point Mumbai Maharashtra : 400021 <BR>Tel: 91-022-66708600 <BR>Email: geecee.investor@gcvl.in <BR>Website: http://www.geeceeventures.com

Read More

How big is GeeCee Vent.?

24-Jul-2025

As of 24th July, Geecee Ventures Ltd has a market capitalization of 794.00 Cr, with Net Sales of 135.02 Cr and a Net Profit of 46.76 Cr reported in the latest four quarters. The balance sheet for March 2024 shows Shareholder's Funds of 645.14 Cr and Total Assets of 727.94 Cr.

As of 24th July, Geecee Ventures Ltd has a market capitalization of 794.00 Cr, categorized as a Micro Cap company.<BR><BR>In the latest four quarters, the company reported Net Sales of 135.02 Cr and a Net Profit of 46.76 Cr.<BR><BR>The latest annual period for the balance sheet is March 2024, showing Shareholder's Funds of 645.14 Cr and Total Assets of 727.94 Cr.

Read More

Are GeeCee Vent. latest results good or bad?

07-Aug-2025

GeeCee Ventures' latest results are disappointing, with net sales dropping 75.59% year-on-year to Rs 7.63 crore and Profit Before Tax declining 74.44% to Rs 3.51 crore, indicating a negative financial outlook.

GeeCee Ventures has reported disappointing financial results for the quarter ending June 2025. The company experienced a significant decline in key metrics, which indicates a troubling trend. <BR><BR>Net sales fell to Rs 7.63 crore, representing a sharp year-on-year decrease of 75.59%, marking the lowest sales figure in the past five quarters. Profit Before Tax (PBT) also saw a dramatic drop to Rs 3.51 crore, down 74.44% year-on-year, again the lowest in the last five quarters. <BR><BR>Furthermore, the Profit After Tax (PAT) for the last six months was reported at Rs 7.23 crore, reflecting a decline of 74.83% year-on-year. The operating profit (PBDIT) was recorded at Rs 4.10 crore, which is also the lowest in five quarters. Earnings per Share (EPS) decreased to Rs 1.60, indicating reduced profitability for shareholders. <BR><BR>Overall, the financial outlook for GeeCee Ventures appears negative, with significant declines across multiple financial metrics.

Read More

How has been the historical performance of GeeCee Vent.?

12-Nov-2025

GeeCee Vent has shown significant growth in financial performance, with net sales increasing from INR 40.05 crore in March 2023 to INR 135.02 crore in March 2025, alongside improvements in profitability and a positive cash flow recovery. Total assets and liabilities also rose substantially during this period.

Answer:<BR>The historical performance of GeeCee Vent shows significant fluctuations in its financial metrics over the years, with notable growth in recent periods.<BR><BR>Breakdown:<BR>GeeCee Vent's net sales have seen a substantial increase from INR 40.05 crore in March 2023 to INR 135.02 crore in March 2025, following a dip to INR 95.83 crore in March 2022. The total operating income mirrored this trend, rising from INR 40.05 crore in March 2023 to INR 135.02 crore in March 2025. However, raw material costs surged from INR 29.94 crore in March 2023 to INR 137.42 crore in March 2025, impacting the operating profit, which increased to INR 61.39 crore in March 2025 from INR 16.28 crore in March 2023. The profit before tax also improved significantly, reaching INR 58.68 crore in March 2025, compared to INR 14.35 crore in March 2023. Consequently, the profit after tax rose to INR 46.75 crore in March 2025 from INR 11.60 crore in March 2023. The company's total assets grew from INR 616.54 crore in March 2023 to INR 1,191.34 crore in March 2025, while total liabilities increased from INR 616.54 crore to INR 1,191.34 crore in the same period. Cash flow from operating activities turned positive, amounting to INR 215 crore in March 2025, a significant recovery from the negative cash flow of INR 20 crore in March 2024. Overall, the financial performance of GeeCee Vent indicates a recovery and growth trajectory, particularly in sales and profitability metrics.

Read More

How has been the historical performance of GeeCee Vent.?

13-Nov-2025

GeeCee Vent has shown significant growth in net sales, increasing from INR 40.05 crore in March 2023 to INR 135.02 crore in March 2025, while operating profit rose to INR 61.39 crore and profit after tax to INR 46.76 crore. Despite rising raw material costs, the company has improved its cash flow and expanded total assets to INR 1,191.34 crore.

Answer:<BR>The historical performance of GeeCee Vent shows significant fluctuations in key financial metrics over the years, particularly in net sales, profits, and cash flow.<BR><BR>Breakdown:<BR>GeeCee Vent's net sales have seen a notable increase from INR 40.05 crore in March 2023 to INR 135.02 crore in March 2025, with a peak of INR 150.51 crore in March 2019. However, the raw material costs have also risen sharply, reaching INR 137.42 crore in March 2025 from INR 29.94 crore in March 2023. The operating profit (PBDIT) has improved significantly, climbing to INR 61.39 crore in March 2025 from INR 16.28 crore in March 2023, while profit after tax has increased to INR 46.76 crore from INR 11.63 crore in the same period. The company's total assets have expanded to INR 1,191.34 crore in March 2025, up from INR 616.54 crore in March 2023, reflecting a strong growth trajectory. Additionally, cash flow from operating activities has turned positive, reaching INR 215 crore in March 2025, compared to a negative cash flow of INR 20 crore in March 2024. Overall, while GeeCee Vent has faced challenges with rising costs, it has managed to enhance its revenue and profitability significantly in recent years.

Read More

Should I buy, sell or hold GeeCee Vent.?

14-Nov-2025

Why is GeeCee Vent. falling/rising?

04-Dec-2025

As of 04-Dec, Geecee Ventures Ltd's stock price is at 351.10, reflecting a decline of 0.96%. The stock has been on a downward trend, underperforming both the market and its sector, with reduced investor interest indicated by a significant drop in delivery volume.

As of 04-Dec, Geecee Ventures Ltd's stock price is falling, currently at 351.10, which reflects a decrease of 3.4 points or 0.96%. The stock has been on a downward trend, having lost 4.48% over the past week and has experienced consecutive declines for the last five days. This recent performance indicates a significant underperformance compared to the broader market, as it has also underperformed its sector by 0.75% today.<BR><BR>Additionally, the stock is trading below its moving averages across various periods, including the 5-day, 20-day, 50-day, 100-day, and 200-day averages, which typically signals weakness in price momentum. Investor participation has also declined, with delivery volume dropping by 66.72% against the 5-day average, suggesting reduced interest from investors. Overall, these factors contribute to the stock's current falling price trend.

Read More

Is GeeCee Vent. technically bullish or bearish?

05-Dec-2025

As of December 4, 2025, GeeCee Vent. is in a bearish trend with moderate strength, indicated by bearish daily moving averages and mixed signals from the MACD, while significantly underperforming compared to the Sensex.

As of 4 December 2025, the technical trend has changed from mildly bearish to bearish. The current technical stance for GeeCee Vent. is bearish with moderate strength. Key indicators driving this stance include the daily moving averages which are bearish, and the weekly KST and Bollinger Bands also indicating bearish trends. The MACD shows a mildly bullish signal on the weekly but is mildly bearish on the monthly, suggesting mixed signals across time frames. The stock has underperformed significantly year-to-date and over the past year compared to the Sensex, further supporting the bearish outlook.

Read More
iScoreScore
Click here to find our call on this stock
Strong Sell
Sell
Hold
Buy
Strong Buy

MarketsMojo — Loved in India, Now Global

The power of Mojo is now in 29 countries. Explore global equities with the same cutting-edge features you love.

Dashboard
1

The company has declared Negative results for the last 3 consecutive quarters

  • NET SALES(Q) At Rs 17.67 cr has Fallen at -39.53%
  • PBT LESS OI(Q) At Rs 11.65 cr has Fallen at -22.75%
  • PAT(Q) At Rs 10.24 cr has Fallen at -18.4%
2

With ROE of 4.4, it has a Very Expensive valuation with a 0.9 Price to Book Value

3

Despite the size of the company, domestic mutual funds hold only 0% of the company

4

Underperformed the market in the last 1 year

stock-summaryMojo Parameters
Mojo Parameters
Loading Valuation Snapshot...
Stock DNA
stock-summary
Industry

Realty

stock-summary
Market cap

INR 746 Cr (Micro Cap)

stock-summary
P/E

20.00

stock-summary
Industry P/E

40

stock-summary
Dividend Yield

0.00%

stock-summary
Debt Equity

-0.61

stock-summary
Return on Equity

4.44%

stock-summary
Price to Book

0.88

Revenue and Profits:
Net Sales:
18 Cr
(Quarterly Results - Sep 2025)
Net Profit:
10 Cr
stock-summaryTotal Returns
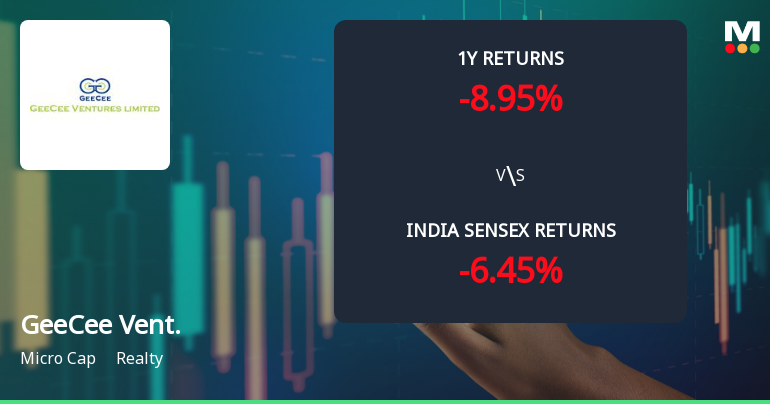
Total Returns (Price + Dividend) stock-summary
Dividend Yield (0%)
TimePeriod
Price Return
Dividend Return
Total Return
3 Months
-8.63%
0%
-8.63%
6 Months
-9.73%
0%
-9.73%
1 Year
-17.7%
0%
-17.7%
2 Years
74.61%
0.88%
75.49%
3 Years
105.95%
2.55%
108.5%
4 Years
141.17%
2.95%
144.12%
5 Years
355.45%
6.74%
362.19%

Latest dividend: 2 per share ex-dividend date: Sep-04-2024

Risk Adjusted Returns v/s stock-summary
Returns Beta
Icon
Beta has not been calculated since enough price history is not available
stock-summaryNews & Corporate Actions
News
Announcements stock-summary

GeeCee Ventures Limited - Other General Purpose

18-Nov-2019 | Source : NSE

GeeCee Ventures Limited has submitted a copy ofá disclosure of Related Party Transactions and balances for the half year ended September 30, 2019.

GeeCee Ventures Limited - Outcome of Board Meeting

08-Nov-2019 | Source : NSE

GeeCee Ventures Limited has informed the Exchange regarding Board meeting held on November 07, 2019.

GeeCee Ventures Limited - Updates

31-Oct-2019 | Source : NSE

GeeCee Ventures Limited has informed the Exchange regarding 'Notice of Board Meeting published on 31st October, 2019 in Business Standard and Navshakti.'.

Corporate Actions stock-summary
stock-summary
BOARD MEETING

No Upcoming Board Meetings

stock-summary
DIVIDEND

Geecee Ventures Ltd has declared 20% dividend, ex-date: 04 Sep 24

stock-summary
SPLITS

No Splits history available

stock-summary
BONUS

No Bonus history available

stock-summary
RIGHTS

No Rights history available

stock-summaryKey Factors
Quality key factors stock-summary
Factor
Value
Sales Growth (5y)
31.47%
EBIT Growth (5y)
42.99%
EBIT to Interest (avg)
33.00
Debt to EBITDA (avg)
Net Debt is too low
Net Debt to Equity (avg)
-0.61
Sales to Capital Employed (avg)
0.14
Tax Ratio
18.72%
Dividend Payout Ratio
8.94%
Pledged Shares
0
Institutional Holding
0.12%
ROCE (avg)
7.39%
ROE (avg)
3.98%
Valuation key factors
Factor
Value
P/E Ratio
20
Industry P/E
13
Price to Book Value
0.88
EV to EBIT
5.13
EV to EBITDA
4.89
EV to Capital Employed
0.70
EV to Sales
2.31
PEG Ratio
NA
Dividend Yield
NA
ROCE (Latest)
13.68%
ROE (Latest)
4.44%
Technicals key factors
Indicator
Weekly
Monthly
MACD
Mildly Bullish
Mildly Bearish
RSI
No Signal
No Signal
Bollinger Bands
Bearish
Bearish
Moving Averages
Bearish (Daily)
KST
Bearish
Mildly Bearish
Dow Theory
Mildly Bearish
No Trend
OBV
Mildly Bullish
No Trend
stock-summary Technical Indicator Scale: Bearish, Mildly Bearish, Sideways, Mildly Bullish, Bullish  Turned 
stock-summaryShareholding
Shareholding Snapshot : Sep 2025stock-summary
Shareholding Compare (%holding) stock-summary
Majority shareholders

Promoters

Pledged Promoter Holdings

None

Mutual Funds

Held by 0 Schemes

FIIs

Held by 1 FIIs (0.01%)

Promoter with highest holding

Meena A Kothari (20.56%)

Highest Public shareholder

Minix Holdings Pvt Ltd (4.85%)

Individual Investors Holdings

22.89%

stock-summaryFinancial
[
  {
    "link": "quarterly",
    "btn_text": "All Quarterly Results",
    "header": "Quarterly Results Snapshot (Consolidated) - Sep'25 - YoY",
    "rhs": [
      {
        "prefix": "Net Sales ",
        "suffix": "YoY Growth in quarter ended Sep 2025 is -39.53% vs 238.59% in Sep 2024",
        "dir": -1
      },
      {
        "prefix": "Consolidated Net Profit ",
        "suffix": "YoY Growth in quarter ended Sep 2025 is -18.41% vs 182.02% in Sep 2024",
        "dir": -1
      }
    ],
    "table": {
      "header": [
        "Sep'25",
        "Sep'24",
        "Change(%)"
      ],
      "body": [
        {
          "field": "Net Sales",
          "val1": "17.67",
          "val2": "29.22",
          "chgp": "-39.53%",
          "chgp_class": "negative"
        },
        {
          "field": "Operating Profit (PBDIT) excl Other Income",
          "val1": "12.24",
          "val2": "15.84",
          "chgp": "-22.73%",
          "chgp_class": "negative"
        },
        {
          "field": "Interest",
          "val1": "0.04",
          "val2": "0.22",
          "chgp": "-81.82%",
          "chgp_class": "positive"
        },
        {
          "field": "Exceptional Items",
          "val1": "0.00",
          "val2": "0.00",
          "chgp": "",
          "chgp_class": "neutral"
        },
        {
          "field": "Consolidate Net Profit",
          "val1": "10.24",
          "val2": "12.55",
          "chgp": "-18.41%",
          "chgp_class": "negative"
        },
        {
          "field": "Operating Profit Margin (Excl OI)",
          "val1": "69.27%",
          "val2": "54.21%",
          "chgp": "15.06%",
          "chgp_class": "positive"
        }
      ]
    }
  },
  {
    "link": "half-yearly",
    "btn_text": "All Half Yearly Results",
    "header": "Half Yearly Results Snapshot (Consolidated) - Sep'25",
    "rhs": [
      {
        "prefix": "Net Sales ",
        "suffix": " Growth in half year ended Sep 2025 is -58.17% vs 205.20% in Sep 2024",
        "dir": -1
      },
      {
        "prefix": "Consolidated Net Profit ",
        "suffix": " Growth in half year ended Sep 2025 is -41.91% vs 130.37% in Sep 2024",
        "dir": -1
      }
    ],
    "table": {
      "header": [
        "Sep'25",
        "Sep'24",
        "Change(%)"
      ],
      "body": [
        {
          "field": "Net Sales",
          "val1": "25.30",
          "val2": "60.49",
          "chgp": "-58.17%",
          "chgp_class": "negative"
        },
        {
          "field": "Operating Profit (PBDIT) excl Other Income",
          "val1": "16.34",
          "val2": "30.11",
          "chgp": "-45.73%",
          "chgp_class": "negative"
        },
        {
          "field": "Interest",
          "val1": "0.08",
          "val2": "0.23",
          "chgp": "-65.22%",
          "chgp_class": "positive"
        },
        {
          "field": "Exceptional Items",
          "val1": "0.00",
          "val2": "0.00",
          "chgp": "",
          "chgp_class": "neutral"
        },
        {
          "field": "Consolidate Net Profit",
          "val1": "13.57",
          "val2": "23.36",
          "chgp": "-41.91%",
          "chgp_class": "negative"
        },
        {
          "field": "Operating Profit Margin (Excl OI)",
          "val1": "64.58%",
          "val2": "49.78%",
          "chgp": "14.80%",
          "chgp_class": "positive"
        }
      ]
    }
  },
  {
    "link": "nine-monthly",
    "btn_text": "All Nine Monthly Results",
    "header": "Nine Monthly Results Snapshot (Consolidated) - Dec'24",
    "rhs": [
      {
        "prefix": "Net Sales ",
        "suffix": "YoY Growth in nine months ended Dec 2024 is 255.49% vs -32.84% in Dec 2023",
        "dir": 1
      },
      {
        "prefix": "Consolidated Net Profit ",
        "suffix": "YoY Growth in nine months ended Dec 2024 is 121.66% vs -14.95% in Dec 2023",
        "dir": 1
      }
    ],
    "table": {
      "header": [
        "Dec'24",
        "Dec'23",
        "Change(%)"
      ],
      "body": [
        {
          "field": "Net Sales",
          "val1": "119.23",
          "val2": "33.54",
          "chgp": "255.49%",
          "chgp_class": "positive"
        },
        {
          "field": "Operating Profit (PBDIT) excl Other Income",
          "val1": "56.34",
          "val2": "22.77",
          "chgp": "147.43%",
          "chgp_class": "positive"
        },
        {
          "field": "Interest",
          "val1": "0.48",
          "val2": "0.05",
          "chgp": "860.00%",
          "chgp_class": "negative"
        },
        {
          "field": "Exceptional Items",
          "val1": "0.00",
          "val2": "0.00",
          "chgp": "",
          "chgp_class": "neutral"
        },
        {
          "field": "Consolidate Net Profit",
          "val1": "42.87",
          "val2": "19.34",
          "chgp": "121.66%",
          "chgp_class": "positive"
        },
        {
          "field": "Operating Profit Margin (Excl OI)",
          "val1": "47.25%",
          "val2": "67.89%",
          "chgp": "-20.64%",
          "chgp_class": "negative"
        }
      ]
    }
  },
  {
    "link": "annual",
    "btn_text": "All Annual Results",
    "header": "Annual Results Snapshot (Consolidated) - Mar'25",
    "rhs": [
      {
        "prefix": "Net Sales ",
        "suffix": "YoY Growth in year ended Mar 2025 is 39.66% vs 141.40% in Mar 2024",
        "dir": -1
      },
      {
        "prefix": "Consolidated Net Profit ",
        "suffix": "YoY Growth in year ended Mar 2025 is 25.53% vs 220.29% in Mar 2024",
        "dir": -1
      }
    ],
    "table": {
      "header": [
        "Mar'25",
        "Mar'24",
        "Change(%)"
      ],
      "body": [
        {
          "field": "Net Sales",
          "val1": "135.02",
          "val2": "96.68",
          "chgp": "39.66%",
          "chgp_class": "positive"
        },
        {
          "field": "Operating Profit (PBDIT) excl Other Income",
          "val1": "60.83",
          "val2": "44.97",
          "chgp": "35.27%",
          "chgp_class": "positive"
        },
        {
          "field": "Interest",
          "val1": "0.55",
          "val2": "0.06",
          "chgp": "816.67%",
          "chgp_class": "negative"
        },
        {
          "field": "Exceptional Items",
          "val1": "0.00",
          "val2": "0.00",
          "chgp": "",
          "chgp_class": "neutral"
        },
        {
          "field": "Consolidate Net Profit",
          "val1": "46.76",
          "val2": "37.25",
          "chgp": "25.53%",
          "chgp_class": "positive"
        },
        {
          "field": "Operating Profit Margin (Excl OI)",
          "val1": "45.05%",
          "val2": "46.51%",
          "chgp": "-1.46%",
          "chgp_class": "negative"
        }
      ]
    }
  }
]
Quarterly Results Snapshot (Consolidated) - Sep'25 - YoYstock-summary
Sep'25
Sep'24
Change(%)
Net Sales
17.67
29.22
-39.53%
Operating Profit (PBDIT) excl Other Income
12.24
15.84
-22.73%
Interest
0.04
0.22
-81.82%
Exceptional Items
0.00
0.00
Consolidate Net Profit
10.24
12.55
-18.41%
Operating Profit Margin (Excl OI)
69.27%
54.21%
15.06%
Values in Rs Cr.
Direction Arrows
Net Sales

YoY Growth in quarter ended Sep 2025 is -39.53% vs 238.59% in Sep 2024

Direction Arrows
Consolidated Net Profit

YoY Growth in quarter ended Sep 2025 is -18.41% vs 182.02% in Sep 2024

Half Yearly Results Snapshot (Consolidated) - Sep'25stock-summary
Sep'25
Sep'24
Change(%)
Net Sales
25.30
60.49
-58.17%
Operating Profit (PBDIT) excl Other Income
16.34
30.11
-45.73%
Interest
0.08
0.23
-65.22%
Exceptional Items
0.00
0.00
Consolidate Net Profit
13.57
23.36
-41.91%
Operating Profit Margin (Excl OI)
64.58%
49.78%
14.80%
Values in Rs Cr.
Direction Arrows
Net Sales

Growth in half year ended Sep 2025 is -58.17% vs 205.20% in Sep 2024

Direction Arrows
Consolidated Net Profit

Growth in half year ended Sep 2025 is -41.91% vs 130.37% in Sep 2024

Nine Monthly Results Snapshot (Consolidated) - Dec'24stock-summary
Dec'24
Dec'23
Change(%)
Net Sales
119.23
33.54
255.49%
Operating Profit (PBDIT) excl Other Income
56.34
22.77
147.43%
Interest
0.48
0.05
860.00%
Exceptional Items
0.00
0.00
Consolidate Net Profit
42.87
19.34
121.66%
Operating Profit Margin (Excl OI)
47.25%
67.89%
-20.64%
Values in Rs Cr.
Direction Arrows
Net Sales

YoY Growth in nine months ended Dec 2024 is 255.49% vs -32.84% in Dec 2023

Direction Arrows
Consolidated Net Profit

YoY Growth in nine months ended Dec 2024 is 121.66% vs -14.95% in Dec 2023

Annual Results Snapshot (Consolidated) - Mar'25stock-summary
Mar'25
Mar'24
Change(%)
Net Sales
135.02
96.68
39.66%
Operating Profit (PBDIT) excl Other Income
60.83
44.97
35.27%
Interest
0.55
0.06
816.67%
Exceptional Items
0.00
0.00
Consolidate Net Profit
46.76
37.25
25.53%
Operating Profit Margin (Excl OI)
45.05%
46.51%
-1.46%
Values in Rs Cr.
Direction Arrows
Net Sales

YoY Growth in year ended Mar 2025 is 39.66% vs 141.40% in Mar 2024

Direction Arrows
Consolidated Net Profit

YoY Growth in year ended Mar 2025 is 25.53% vs 220.29% in Mar 2024

stock-summaryCompany CV
About Geecee Ventures Ltd stock-summary
stock-summary
Geecee Ventures Ltd
Micro Cap
Realty
GeeCee Ventures Ltd was incorporated on February 14, 1984 as a private limited company with the name Shubham Aromatics Pvt Ltd.
Company Coordinates stock-summary
Company Details
209/210 Arcadia Building, 2nd Floor 195 Nariman Point Mumbai Maharashtra : 400021
stock-summary
Tel: 91-022-66708600
stock-summary
geecee.investor@gcvl.in
Registrar Details
Link Intime India Pvt Ltd, C-13 Pannalal Silk Compound, L B S Marg, Bhandup , Mumbai