
Compare Birlasoft Ltd with Similar Stocks
Dashboard
High Management Efficiency with a high ROE of 16.74%
The company is Net-Debt Free
Poor long term growth as Net Sales has grown by an annual rate of 8.20% over the last 5 years
Positive results in Mar 26
With ROE of 12.5, it has a Expensive valuation with a 2.8 Price to Book Value
High Institutional Holdings at 36.99%
Below par performance in long term as well as near term
Stock DNA
Computers - Software & Consulting
INR 10,488 Cr (Small Cap)
21.00
21
1.74%
-0.51
12.47%
2.80
Total Returns (Price + Dividend) 
Latest dividend: 2.5 per share ex-dividend date: Nov-14-2025
Risk Adjusted Returns v/s
Returns Beta

News
When is the next results date for Birlasoft Ltd?
The next results date for Birlasoft Ltd is scheduled for 06 May 2026....
Read full news article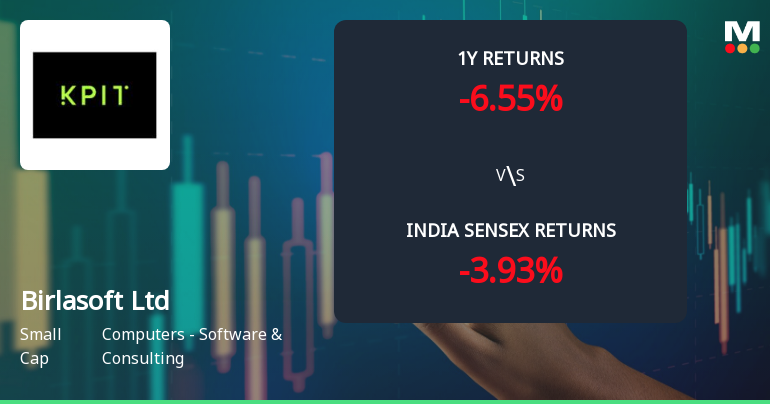
Birlasoft Ltd Faces Intensified Bearish Momentum Amid Technical Downgrade
Birlasoft Ltd, a player in the Computers - Software & Consulting sector, has experienced a notable shift in its technical momentum, with key indicators signalling a bearish trend. The stock’s recent price action and technical parameters suggest increased selling pressure, raising concerns for investors amid a challenging market backdrop.
Read full news article
Birlasoft Ltd is Rated Sell by MarketsMOJO
Birlasoft Ltd is rated 'Sell' by MarketsMOJO, with this rating last updated on 18 February 2026. However, the analysis and financial metrics discussed here reflect the stock's current position as of 26 April 2026, providing investors with an up-to-date view of the company’s fundamentals, returns, and market performance.
Read full news article Announcements
BIRLASOFT LIMITED - Press Release
09-Dec-2019 | Source : NSEBIRLASOFT LIMITED has informed the Exchange regarding a press release dated December 09, 2019, titled "Birlasoft Honored with the ACE Alliance Award for successful partnership with SAP".
BIRLASOFT LIMITED - Analysts/Institutional Investor Meet/Con. Call Updates
03-Dec-2019 | Source : NSEBIRLASOFT LIMITED has informed the Exchange regarding Analysts/Institutional Investor Meet/Con. Call Updates
BIRLASOFT LIMITED - Press Release
28-Nov-2019 | Source : NSEBIRLASOFT LIMITED has informed the Exchange regarding a press release dated November 28, 2019, titled "BIRlASOFT LAUNCHES FIRST #XCCELERATE4STARTUPS CONTEST RECOGNIZING THE MOST INNOVATIVE STARTUP ".
Corporate Actions

(06 May 2026)

Birlasoft Ltd has declared 125% dividend, ex-date: 14 Nov 25

Birlasoft Ltd has announced 2:5 stock split, ex-date: 04 Jan 07

Birlasoft Ltd has announced 1:1 bonus issue, ex-date: 13 Mar 12

No Rights history available
Quality key factors
Valuation key factors
Technicals key factors
 Technical Indicator Scale: Bearish, Mildly Bearish, Sideways, Mildly Bullish, Bullish Turned
 Shareholding Snapshot : Mar 2026
Shareholding Compare (%holding)
Promoters
None
Held by 26 Schemes (21.74%)
Held by 204 FIIs (13.65%)
National Engineering Industries Limited (38.55%)
Kotak Midcap Fund (7.12%)
18.36%
Quarterly Results Snapshot (Consolidated) - Mar'26 - QoQ

QoQ Growth in quarter ended Mar 2026 is 0.08% vs 1.40% in Dec 2025

QoQ Growth in quarter ended Mar 2026 is 46.74% vs 3.26% in Dec 2025
Half Yearly Results Snapshot (Consolidated) - Sep'25
Growth in half year ended Sep 2025 is -3.04% vs 4.78% in Sep 2024
Growth in half year ended Sep 2025 is -19.87% vs -1.74% in Sep 2024
Nine Monthly Results Snapshot (Consolidated) - Dec'25
YoY Growth in nine months ended Dec 2025 is -2.39% vs 3.65% in Dec 2024
YoY Growth in nine months ended Dec 2025 is -13.23% vs -11.05% in Dec 2024
Annual Results Snapshot (Consolidated) - Mar'26
YoY Growth in year ended Mar 2026 is -1.21% vs 1.84% in Mar 2025
YoY Growth in year ended Mar 2026 is 0.31% vs -17.15% in Mar 2025
About Birlasoft Ltd

Company Coordinates


