Cyient

  • Market Cap: Small Cap
  • Industry: Computers - Software & Consulting
  • ISIN: INE136B01020
  • NSEID: CYIENT
  • BSEID: 532175
INR
1,103.40
-14.8 (-1.32%)
BSENSE

Jan 29

BSE+NSE Vol: 37.17 k

  • Price Points
  • Score
  • Mojo Parameters
  • Total Return
  • News and Corporate Actions
  • Key factors
  • Shareholding
  • Financials
  • CompanyCV
stock-summaryPrice Point
High/Low

1Day

52 Week

Valuation
Technical
Day's Volume

CASH

37.17 k (-71.84%) Volume

Shareholding (Dec 2025)

FII

15.28%

Held by 176 FIIs

DII

2.46%

Held by 51 DIIs

Promoter

23.29%

When is the next results date for Cyient?

06-Jun-2025

No Upcoming Board Meetings

Who are in the management team of Cyient?

06-Jun-2025

As of March 2023, the management team of Cyient includes B V R Mohan Reddy (Founder Chairman), M M Murugappan (Chairman), Krishna Bodanapu (Executive Vice Chairman & Managing Director), Karthik Natarajan (Executive Director & CEO), and several non-executive and independent directors. They oversee the company's operations and strategic direction.

As of March 2023, the management team of Cyient includes the following individuals:<BR><BR>1. B V R Mohan Reddy - Founder Chairman<BR>2. M M Murugappan - Chairman (Non-Executive)<BR>3. Sudheendhra Putty - Company Secretary & Compliance Officer<BR>4. Krishna Bodanapu - Executive Vice Chairman & Managing Director<BR>5. Vikas Sehgal - Non-Executive & Independent Director<BR>6. Vivek Narayan Gour - Non-Executive & Independent Director<BR>7. Matangi Gowrishankar - Non-Executive & Independent Director<BR>8. Ramesh Abhishek - Non-Executive & Independent Director<BR>9. Karthik Natarajan - Executive Director & CEO<BR>10. Nitin Prasad - Independent Director<BR><BR>This team is responsible for overseeing the operations and strategic direction of the company.

View full answer

What does Cyient do?

06-Jun-2025

Cyient Ltd. is a mid-cap technology company specializing in geospatial, engineering design, IT solutions, and data analytics, with net sales of ₹1,909 Cr and a net profit of ₹170 Cr for the quarter ending March 2025. It has a market cap of ₹14,736 Cr and key metrics include a P/E of 24.00 and a dividend yield of 1.34%.

Overview: <BR>Cyient Ltd. is a mid-cap company in the Computers - Software & Consulting industry, providing global technology services and solutions specializing in geospatial, engineering design, IT solutions, and data analytics.<BR><BR>History: <BR>Cyient Limited, formerly known as Infotech Enterprises Ltd, was incorporated in 1991. The latest quarterly results reported net sales and net profit for the period ending March 2025.<BR><BR>Financial Snapshot: <BR>Net Sales: 1,909 Cr (Quarterly Results - Mar 2025) <BR>Net Profit: 170 Cr (Quarterly Results - Mar 2025) <BR>Market Cap: Rs 14,736 Cr (Mid Cap)<BR><BR>Key Metrics: <BR>P/E: 24.00 <BR>Industry P/E: 29 <BR>Dividend Yield: 1.34% <BR>Debt-Equity: -0.18 <BR>Return on Equity: 11.60% <BR>Price to Book: 2.81<BR><BR>Contact Details: <BR>Address: 4th Floor A-Wing Plot No 11, Software Unit Layout Madhapur Hyderabad Telangana : 500081 <BR>Tel: 91-40-67641000/67641696/23124006 <BR>Email: company.secretary@cyient.com <BR>Website: http://www.cyient.com

View full answer

What is the bonus history of the Cyient?

06-Jun-2025

Cyient has issued bonuses twice: a 1:1 bonus on June 10, 2010, and a 1:2 bonus on July 28, 2006, demonstrating its commitment to rewarding shareholders.

Cyient has a notable bonus history with two significant bonus issues. The latest bonus was a 1:1 bonus issue, which was announced with an ex-date of June 10, 2010, and the record date was June 12, 2010. Prior to that, Cyient issued a 1:2 bonus on July 28, 2006, with a record date of August 4, 2006. This reflects the company's approach to rewarding its shareholders through bonus shares over the years.

View full answer

Has Cyient declared dividend?

06-Jun-2025

Yes, Cyient Ltd. has declared a dividend of 360% (₹18 per share) with an ex-date of June 21, 2024. While short-term returns show a decline, longer periods reflect positive total returns, bolstered by the dividend.

Cyient Ltd. has declared a dividend.<BR><BR>Dividend Details:<BR>- Percentage announced: 360%<BR>- Amount per share: 18<BR>- Ex-date: 21 Jun 24<BR><BR>Dividend Yield: 1.34%.<BR><BR>Total Returns by Period:<BR>In the 6-month period, the price return was -33.9%, with a dividend return of 0%, resulting in a total return of -33.9%.<BR><BR>For the 1-year period, the price return was -26.74%, the dividend return was 0.97%, leading to a total return of -25.77%.<BR><BR>Over the 2-year period, the price return was -1.47%, the dividend return was 1.98%, culminating in a total return of 0.51%.<BR><BR>In the 3-year period, the price return was 66.87%, with a dividend return of 7.07%, resulting in a total return of 73.94%.<BR><BR>For the 4-year period, the price return was 64.34%, the dividend return was 9.61%, leading to a total return of 73.95%.<BR><BR>In the 5-year period, the price return was 498.93%, with a dividend return of 35.38%, resulting in a total return of 534.31%.<BR><BR>Overall, Cyient has declared a significant dividend, which contributes positively to the total returns, especially over longer periods. However, the short-term returns indicate a decline in price, highlighting volatility in the company's stock performance.

View full answer

Who are the peers of the Cyient?

03-Jun-2025

Cyient's peers include TCS, Infosys, HCL Technologies, Wipro, Tech Mahindra, Sonata Software, Netweb Technologies, Birlasoft Ltd, Black Box, and Happiest Minds. In terms of management risk, growth ratings, and capital structure, Cyient is positioned with good management risk and growth, while its 1-year return is -23.43%, better than Birlasoft Ltd but lower than its other peers.

Peers: The peers of Cyient are TCS, Infosys, HCL Technologies, Wipro, Tech Mahindra, Sonata Software, Netweb Technol., Birlasoft Ltd, Black Box, and Happiest Minds.<BR><BR>Quality Snapshot: Excellent management risk is observed at TCS, Infosys, HCL Technologies, Sonata Software, Netweb Technol., and Happiest Minds, while Good management risk is found at Cyient, Wipro, Tech Mahindra, and Birlasoft Ltd. Average management risk is present at Black Box. Growth ratings show Excellent growth at Netweb Technol., while Good growth is noted at TCS, Infosys, Cyient, and Sonata Software. Average growth is found at HCL Technologies and Birlasoft Ltd, with Below Average growth at Wipro and Tech Mahindra, and the rest showing Average growth. Capital Structure is Excellent for TCS, Infosys, HCL Technologies, Wipro, Tech Mahindra, Cyient, Sonata Software, Netweb Technol., and Birlasoft Ltd, while Black Box has a Good capital structure.<BR><BR>Return Snapshot: The peer with the highest 1-year return is Black Box at 140.10%, while the lowest is Birlasoft Ltd at -35.85%. Cyient's own 1-year return is -23.43%, which is higher than Birlasoft Ltd's but lower than the rest. Additionally, Wipro, Tech Mahindra, Sonata Software, Birlasoft Ltd, and Happiest Minds have negative six-month returns.

View full answer

Is Cyient overvalued or undervalued?

09-Jun-2025

As of January 24, 2025, Cyient's valuation has improved to attractive, indicating it is currently undervalued with a PE ratio of 23.99, lower than its peers TCS and HCL Technologies, and despite recent underperformance, it has shown significant long-term growth of 503.38% over five years.

As of 24 January 2025, the valuation grade for Cyient has moved from fair to attractive, indicating a positive shift in its perceived value. The company is currently considered undervalued. Key ratios include a PE ratio of 23.99, an EV to EBITDA of 12.07, and a ROCE of 20.17%. <BR><BR>In comparison to its peers, Cyient's PE ratio is lower than TCS's 25.23 and HCL Technologies' 25.52, suggesting that Cyient may offer better value relative to these competitors. Additionally, while Infosys is rated fair with a PE of 24.32, Cyient's attractive rating and lower valuation metrics position it favorably. Despite recent underperformance against the Sensex, particularly in the year-to-date and one-year returns, the long-term performance over five years shows a significant gain of 503.38%, reinforcing the potential for future growth.

View full answer

Who are the top shareholders of the Cyient?

17-Jul-2025

The top shareholders of Cyient include mutual funds (28.06%), foreign institutional investors (23.85%), and individual investors (11.6%). Vineyard Point Software Private Limited is the largest promoter with a 12.61% stake, while Amansa Holdings Private Limited is the largest public shareholder at 5.94%.

The top shareholders of Cyient include a mix of mutual funds, foreign institutional investors (FIIs), and individual investors. The majority of the shares are held by mutual funds, accounting for 28.06% of the total. FIIs hold 23.85% of the shares. <BR><BR>The promoter with the highest holding is Vineyard Point Software Private Limited, which owns 12.61%. Among public shareholders, Amansa Holdings Private Limited is the largest, holding 5.94%. Individual investors collectively hold 11.6% of the shares. <BR><BR>This diverse shareholder base reflects a strong interest from both institutional and individual investors in Cyient.

View full answer

How big is Cyient?

24-Jul-2025

As of 24th July, Cyient Ltd. has a market capitalization of 14,020.00 Cr, with net sales of 7,360.40 Cr and a net profit of 615.70 Cr reported in the latest four quarters. The company has shareholder's funds of 5,309.50 Cr and total assets of 7,608.50 Cr for the annual period ending March 2025.

As of 24th July, Cyient Ltd. has a market capitalization of 14,020.00 Cr, categorizing it as a Mid Cap company.<BR><BR>In the latest four quarters, Cyient reported net sales of 7,360.40 Cr and a net profit of 615.70 Cr.<BR><BR>For the latest annual period ending March 2025, the company has shareholder's funds amounting to 5,309.50 Cr and total assets of 7,608.50 Cr.

View full answer

How has been the historical performance of Cyient?

16-Oct-2025

Cyient has demonstrated steady growth in net sales and total assets from March 2022 to March 2025, with net sales rising from 4,534.40 Cr to 7,360.40 Cr. However, profit margins have fluctuated, with a decline in operating profit and net profit in March 2025 compared to the previous year.

Answer:<BR>The historical performance of Cyient shows a steady growth in net sales and profit over the years, with some fluctuations in profit margins.<BR><BR>Breakdown:<BR>Cyient's net sales have increased from 4,534.40 Cr in March 2022 to 7,360.40 Cr in March 2025, reflecting a consistent upward trend. The total operating income followed a similar trajectory, rising from 4,534.40 Cr in March 2022 to 7,360.40 Cr in March 2025. However, the operating profit (PBDIT) excluding other income peaked at 1,302.80 Cr in March 2024 before declining to 1,143.30 Cr in March 2025. Profit before tax also showed fluctuations, reaching 879.90 Cr in March 2025 after a high of 918.40 Cr in March 2024. The profit after tax decreased slightly from 702.80 Cr in March 2024 to 653.20 Cr in March 2025, while the consolidated net profit also fell from 682.80 Cr to 615.70 Cr during the same period. On the balance sheet, total assets grew from 4,762.50 Cr in March 2022 to 7,608.50 Cr in March 2025, with total liabilities increasing correspondingly from 4,762.50 Cr to 7,608.50 Cr. Cash flow from operating activities improved from 553.00 Cr in March 2023 to 789.00 Cr in March 2025, contributing to a net cash inflow of 597.00 Cr in March 2025, a significant recovery from the outflows in previous years. Overall, while Cyient has shown growth in sales and assets, profit margins have experienced some volatility.

View full answer

Is Cyient technically bullish or bearish?

02-Dec-2025

As of December 1, 2025, Cyient's technical trend is mildly bearish, influenced by bearish daily moving averages and weekly Bollinger Bands, despite some short-term bullish signals from the MACD and KST, indicating market indecision.

As of 1 December 2025, the technical trend for Cyient has changed from bearish to mildly bearish. The current stance is mildly bearish, driven primarily by the daily moving averages indicating a bearish sentiment and the weekly Bollinger Bands also reflecting a mildly bearish outlook. While the weekly MACD shows a mildly bullish signal, the monthly MACD remains bearish, indicating a mixed longer-term perspective. The KST is mildly bullish on the weekly timeframe but bearish monthly, further contributing to the overall mildly bearish sentiment. The lack of clear signals from the RSI and OBV suggests indecision in the market. Overall, the indicators point towards a cautious bearish sentiment with some short-term bullish signs.

View full answer

Are Cyient Ltd. latest results good or bad?

23-Jan-2026

Cyient Ltd.'s latest results are unfavorable, showing a 28.81% year-on-year decline in net profit and a significant drop in operating margins, raising concerns about the company's profitability and growth prospects. The stock has also underperformed, declining 33.06% over the past year.

Cyient Ltd.'s latest results indicate a challenging financial performance. In Q2 FY26, the company reported a consolidated net profit of ₹127.50 crore, which represents a significant decline of 28.81% year-on-year and 17.10% quarter-on-quarter. This drop in profitability is concerning, especially as it reflects ongoing pressures on the company's bottom line.<BR><BR>While net sales showed a modest sequential improvement of 4.04% to ₹1,781 crore, they still declined by 3.68% compared to the same quarter last year. Additionally, the operating margin, excluding other income, fell sharply to 12.29%, down 376 basis points year-on-year, indicating deteriorating operational efficiency.<BR><BR>The stock has faced severe underperformance, declining 33.06% over the past year, which starkly contrasts with the Sensex's gain of 7.73%. This underperformance suggests that investors are worried about Cyient's ability to navigate current market challenges and operational headwinds.<BR><BR>Overall, the results can be characterized as unfavorable, with significant declines in both profit and margins, raising concerns about the company's future profitability and growth prospects.

View full answer

Should I buy, sell or hold Cyient Ltd.?

23-Jan-2026

Why is Cyient Ltd. falling/rising?

28-Jan-2026

As of 28-Jan, Cyient Ltd. is seeing a stock price increase to 1,120.95, but it has underperformed its sector and broader market over the past year, with negative financial results in recent quarters. Despite a low debt-to-equity ratio and healthy long-term growth, investor sentiment may be cautious due to these challenges.

As of 28-Jan, Cyient Ltd. is experiencing a rise in its stock price, currently at 1,120.95, with a change of 11.55 (1.04%) upward. This increase follows a two-day consecutive gain where the stock has risen by 3.23%. However, it is important to note that despite this recent uptick, the stock has underperformed its sector by 0.29% today and is trading below its moving averages across various time frames, indicating a potential weakness in its price momentum.<BR><BR>The stock's performance over the past year has been challenging, with a decline of 15.01%, and it has underperformed the broader market indices such as the Sensex. Additionally, the company has reported negative results for the last four consecutive quarters, with significant declines in profit before tax and profit after tax. This has contributed to a perception of below-par performance both in the near term and long term.<BR><BR>On a positive note, Cyient Ltd. has a low debt-to-equity ratio, indicating financial stability, and has shown healthy long-term growth in operating profit at an annual rate of 17.29%. The stock is also considered to have an attractive valuation compared to its peers, with high institutional holdings at 54.78%, suggesting confidence from larger investors.<BR><BR>In summary, while Cyient Ltd. is currently experiencing a rise in stock price, the overall context includes significant challenges such as recent negative financial results and underperformance over the past year, which may temper investor sentiment moving forward.

View full answer
iScoreScore
Click here to find our call on this stock
Strong Sell
Sell
Hold
Buy
Strong Buy

MarketsMojo — Loved in India, Now Global

The power of Mojo is now in 29 countries. Explore global equities with the same cutting-edge features you love.

Dashboard

1

The company has declared Negative results for the last 4 consecutive quarters

  • PBT LESS OI(Q) At Rs 150.70 cr has Fallen at -20.77%
  • PAT(Latest six months) At Rs 233.77 cr has Grown at -22.44%
  • ROCE(HY) Lowest at 14.79%
2

Below par performance in long term as well as near term

stock-summaryMojo Parameters

Mojo Parameters

Loading Valuation Snapshot...

Stock DNA

stock-summary
Industry

Computers - Software & Consulting

stock-summary
Market cap

INR 12,260 Cr (Small Cap)

stock-summary
P/E

22.00

stock-summary
Industry P/E

27

stock-summary
Dividend Yield

2.68%

stock-summary
Debt Equity

-0.21

stock-summary
Return on Equity

10.05%

stock-summary
Price to Book

2.24

Revenue and Profits:
Net Sales:
1,848 Cr
(Quarterly Results - Dec 2025)
Net Profit:
92 Cr
stock-summaryTotal Returns
Total Returns (Price + Dividend) stock-summary
Dividend Yield (2.68%)
TimePeriod
Price Return
Dividend Return
Total Return
3 Months
-6.91%
0%
-6.91%
6 Months
-10.47%
1.32%
-9.15%
1 Year
-19.19%
2.10%
-17.09%
2 Years
-45.01%
2.19%
-42.82%
3 Years
28.87%
8.28%
37.15%
4 Years
20.32%
11.78%
32.1%
5 Years
82.2%
19.41%
101.61%

Latest dividend: 16 per share ex-dividend date: Oct-24-2025

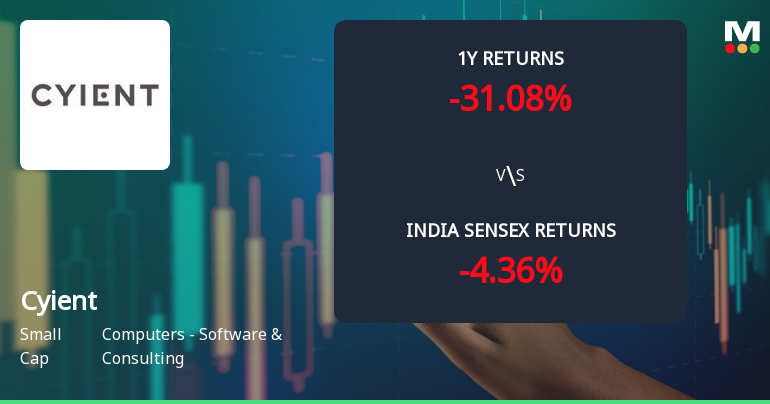
Risk Adjusted Returns v/s stock-summary
Returns Beta
Icon
Beta has not been calculated since enough price history is not available
stock-summaryNews & Corporate Actions

News

Announcements stock-summary

Cyient Limited - Press Release

05-Dec-2019 | Source : NSE

Cyient Limited has informed the Exchange regarding a press release dated December 05, 2019, titled "AnSem, a Cyient Company, Joins the Arm Approved Design Partner Program.".

Cyient Limited - Reply to Clarification Sought

06-Nov-2019 | Source : NSE

Cyient Limited with respect to announcement dated 17-Oct-2019, regarding creation of new Associate Stock Option Scheme. On basis of above the Company was required to clarify following: 1. Brief details of options granted. 2. Whether the scheme is in terms of SEBI (SBEB) Regulations, 2014 (if applicable);3. Total number of shares covered by these options;4. Pricing formula;5. Options vested;6. Time within which option may be exercised; 7. Options exercised;8. Money realized by exercise of options;9. The total number of shares arising as a result of exercise of option;10. Options lapsed;11. Variation of terms of options. 12. Brief details of significant terms;13. Subsequent changes or cancellation or exercise of such options;14. Diluted earnings per share pursuant to issue of equity shares on exercise of options.The response of the Company is attached.

Cyient Limited - Clarification

30-Oct-2019 | Source : NSE

Cyient Limited with respect to announcement dated 17-Oct-2019, regarding creation of new Associate Stock Option Scheme. On basis of above the Company is required to clarify following: 1. Brief details of options granted

Corporate Actions stock-summary

stock-summary
BOARD MEETING

No Upcoming Board Meetings

stock-summary
DIVIDEND

Cyient Ltd. has declared 320% dividend, ex-date: 24 Oct 25

stock-summary
SPLITS

Cyient Ltd. has announced 5:10 stock split, ex-date: 28 Jul 06

stock-summary
BONUS

Cyient Ltd. has announced 1:1 bonus issue, ex-date: 10 Jun 10

stock-summary
RIGHTS

No Rights history available

stock-summaryKey Factors

Quality key factors stock-summary

Factor
Value
Sales Growth (5y)
12.01%
EBIT Growth (5y)
17.29%
EBIT to Interest (avg)
10.13
Debt to EBITDA (avg)
0.84
Net Debt to Equity (avg)
-0.21
Sales to Capital Employed (avg)
1.25
Tax Ratio
27.19%
Dividend Payout Ratio
46.87%
Pledged Shares
0
Institutional Holding
54.78%
ROCE (avg)
21.76%
ROE (avg)
14.28%

Valuation key factors

Factor
Value
P/E Ratio
22
Industry P/E
27
Price to Book Value
2.24
EV to EBIT
15.89
EV to EBITDA
11.42
EV to Capital Employed
2.56
EV to Sales
1.56
PEG Ratio
NA
Dividend Yield
2.68%
ROCE (Latest)
17.14%
ROE (Latest)
10.05%

Technicals key factors

Indicator
Weekly
Monthly
MACD
Mildly Bullish
Bearish
RSI
No Signal
No Signal
Bollinger Bands
Mildly Bearish
Mildly Bearish
Moving Averages
Bearish (Daily)
KST
Mildly Bullish
Bearish
Dow Theory
Mildly Bearish
No Trend
OBV
No Trend
No Trend
stock-summary Technical Indicator Scale: Bearish, Mildly Bearish, Sideways, Mildly Bullish, Bullish  Turned 
stock-summaryShareholding
Shareholding Snapshot : Dec 2025stock-summary
Shareholding Compare (%holding) stock-summary
Majority shareholders

Mutual Funds

Pledged Promoter Holdings

None

Mutual Funds

Held by 22 Schemes (31.99%)

FIIs

Held by 176 FIIs (15.28%)

Promoter with highest holding

Vineyard Point Software Private Limited (12.6%)

Highest Public shareholder

Hdfc Mutual Fund - Hdfc Dividend Yield Fund (6.05%)

Individual Investors Holdings

13.63%

stock-summaryFinancial
[
  {
    "link": "quarterly",
    "btn_text": "All Quarterly Results",
    "header": "Quarterly Results Snapshot (Consolidated) - Dec'25 - YoY",
    "rhs": [
      {
        "prefix": "Net Sales ",
        "suffix": "YoY Growth in quarter ended Dec 2025 is -4.04% vs 5.76% in Dec 2024",
        "dir": -1
      },
      {
        "prefix": "Consolidated Net Profit ",
        "suffix": "YoY Growth in quarter ended Dec 2025 is -24.94% vs -16.92% in Dec 2024",
        "dir": -1
      }
    ],
    "table": {
      "header": [
        "Dec'25",
        "Dec'24",
        "Change(%)"
      ],
      "body": [
        {
          "field": "Net Sales",
          "val1": "1,848.50",
          "val2": "1,926.40",
          "chgp": "-4.04%",
          "chgp_class": "negative"
        },
        {
          "field": "Operating Profit (PBDIT) excl Other Income",
          "val1": "237.20",
          "val2": "278.90",
          "chgp": "-14.95%",
          "chgp_class": "negative"
        },
        {
          "field": "Interest",
          "val1": "14.10",
          "val2": "20.50",
          "chgp": "-31.22%",
          "chgp_class": "positive"
        },
        {
          "field": "Exceptional Items",
          "val1": "-42.30",
          "val2": "0.00",
          "chgp": "",
          "chgp_class": "neutral"
        },
        {
          "field": "Consolidate Net Profit",
          "val1": "91.80",
          "val2": "122.30",
          "chgp": "-24.94%",
          "chgp_class": "negative"
        },
        {
          "field": "Operating Profit Margin (Excl OI)",
          "val1": "12.83%",
          "val2": "14.48%",
          "chgp": "-1.65%",
          "chgp_class": "negative"
        }
      ]
    }
  },
  {
    "link": "half-yearly",
    "btn_text": "All Half Yearly Results",
    "header": "Half Yearly Results Snapshot (Consolidated) - Sep'25",
    "rhs": [
      {
        "prefix": "Net Sales ",
        "suffix": " Growth in half year ended Sep 2025 is -0.91% vs 1.73% in Sep 2024",
        "dir": -1
      },
      {
        "prefix": "Consolidated Net Profit ",
        "suffix": " Growth in half year ended Sep 2025 is -12.91% vs -6.76% in Sep 2024",
        "dir": -1
      }
    ],
    "table": {
      "header": [
        "Sep'25",
        "Sep'24",
        "Change(%)"
      ],
      "body": [
        {
          "field": "Net Sales",
          "val1": "3,492.80",
          "val2": "3,524.80",
          "chgp": "-0.91%",
          "chgp_class": "negative"
        },
        {
          "field": "Operating Profit (PBDIT) excl Other Income",
          "val1": "449.50",
          "val2": "561.70",
          "chgp": "-19.98%",
          "chgp_class": "negative"
        },
        {
          "field": "Interest",
          "val1": "32.20",
          "val2": "53.20",
          "chgp": "-39.47%",
          "chgp_class": "positive"
        },
        {
          "field": "Exceptional Items",
          "val1": "20.70",
          "val2": "0.00",
          "chgp": "",
          "chgp_class": "neutral"
        },
        {
          "field": "Consolidate Net Profit",
          "val1": "281.30",
          "val2": "323.00",
          "chgp": "-12.91%",
          "chgp_class": "negative"
        },
        {
          "field": "Operating Profit Margin (Excl OI)",
          "val1": "12.87%",
          "val2": "15.94%",
          "chgp": "-3.07%",
          "chgp_class": "negative"
        }
      ]
    }
  },
  {
    "link": "nine-monthly",
    "btn_text": "All Nine Monthly Results",
    "header": "Nine Monthly Results Snapshot (Consolidated) - Dec'25",
    "rhs": [
      {
        "prefix": "Net Sales ",
        "suffix": "YoY Growth in nine months ended Dec 2025 is -2.02% vs 3.12% in Dec 2024",
        "dir": -1
      },
      {
        "prefix": "Consolidated Net Profit ",
        "suffix": "YoY Growth in nine months ended Dec 2025 is -16.21% vs -9.79% in Dec 2024",
        "dir": -1
      }
    ],
    "table": {
      "header": [
        "Dec'25",
        "Dec'24",
        "Change(%)"
      ],
      "body": [
        {
          "field": "Net Sales",
          "val1": "5,341.30",
          "val2": "5,451.20",
          "chgp": "-2.02%",
          "chgp_class": "negative"
        },
        {
          "field": "Operating Profit (PBDIT) excl Other Income",
          "val1": "686.70",
          "val2": "840.60",
          "chgp": "-18.31%",
          "chgp_class": "negative"
        },
        {
          "field": "Interest",
          "val1": "46.30",
          "val2": "73.70",
          "chgp": "-37.18%",
          "chgp_class": "positive"
        },
        {
          "field": "Exceptional Items",
          "val1": "-21.60",
          "val2": "0.00",
          "chgp": "",
          "chgp_class": "neutral"
        },
        {
          "field": "Consolidate Net Profit",
          "val1": "373.10",
          "val2": "445.30",
          "chgp": "-16.21%",
          "chgp_class": "negative"
        },
        {
          "field": "Operating Profit Margin (Excl OI)",
          "val1": "12.86%",
          "val2": "15.42%",
          "chgp": "-2.56%",
          "chgp_class": "negative"
        }
      ]
    }
  },
  {
    "link": "annual",
    "btn_text": "All Annual Results",
    "header": "Annual Results Snapshot (Consolidated) - Mar'25",
    "rhs": [
      {
        "prefix": "Net Sales ",
        "suffix": "YoY Growth in year ended Mar 2025 is 2.98% vs 18.81% in Mar 2024",
        "dir": -1
      },
      {
        "prefix": "Consolidated Net Profit ",
        "suffix": "YoY Growth in year ended Mar 2025 is -9.83% vs 32.74% in Mar 2024",
        "dir": -1
      }
    ],
    "table": {
      "header": [
        "Mar'25",
        "Mar'24",
        "Change(%)"
      ],
      "body": [
        {
          "field": "Net Sales",
          "val1": "7,360.40",
          "val2": "7,147.20",
          "chgp": "2.98%",
          "chgp_class": "positive"
        },
        {
          "field": "Operating Profit (PBDIT) excl Other Income",
          "val1": "1,143.30",
          "val2": "1,302.80",
          "chgp": "-12.24%",
          "chgp_class": "negative"
        },
        {
          "field": "Interest",
          "val1": "92.80",
          "val2": "116.00",
          "chgp": "-20.00%",
          "chgp_class": "positive"
        },
        {
          "field": "Exceptional Items",
          "val1": "0.00",
          "val2": "-67.60",
          "chgp": "100.00%",
          "chgp_class": "positive"
        },
        {
          "field": "Consolidate Net Profit",
          "val1": "615.70",
          "val2": "682.80",
          "chgp": "-9.83%",
          "chgp_class": "negative"
        },
        {
          "field": "Operating Profit Margin (Excl OI)",
          "val1": "15.53%",
          "val2": "18.23%",
          "chgp": "-2.70%",
          "chgp_class": "negative"
        }
      ]
    }
  }
]

Quarterly Results Snapshot (Consolidated) - Dec'25 - YoYstock-summary

Dec'25
Dec'24
Change(%)
Net Sales
1,848.50
1,926.40
-4.04%
Operating Profit (PBDIT) excl Other Income
237.20
278.90
-14.95%
Interest
14.10
20.50
-31.22%
Exceptional Items
-42.30
0.00
Consolidate Net Profit
91.80
122.30
-24.94%
Operating Profit Margin (Excl OI)
12.83%
14.48%
-1.65%
Values in Rs Cr.
Direction Arrows
Net Sales

YoY Growth in quarter ended Dec 2025 is -4.04% vs 5.76% in Dec 2024

Direction Arrows
Consolidated Net Profit

YoY Growth in quarter ended Dec 2025 is -24.94% vs -16.92% in Dec 2024

Half Yearly Results Snapshot (Consolidated) - Sep'25stock-summary

Sep'25
Sep'24
Change(%)
Net Sales
3,492.80
3,524.80
-0.91%
Operating Profit (PBDIT) excl Other Income
449.50
561.70
-19.98%
Interest
32.20
53.20
-39.47%
Exceptional Items
20.70
0.00
Consolidate Net Profit
281.30
323.00
-12.91%
Operating Profit Margin (Excl OI)
12.87%
15.94%
-3.07%
Values in Rs Cr.
Direction Arrows
Net Sales

Growth in half year ended Sep 2025 is -0.91% vs 1.73% in Sep 2024

Direction Arrows
Consolidated Net Profit

Growth in half year ended Sep 2025 is -12.91% vs -6.76% in Sep 2024

Nine Monthly Results Snapshot (Consolidated) - Dec'25stock-summary

Dec'25
Dec'24
Change(%)
Net Sales
5,341.30
5,451.20
-2.02%
Operating Profit (PBDIT) excl Other Income
686.70
840.60
-18.31%
Interest
46.30
73.70
-37.18%
Exceptional Items
-21.60
0.00
Consolidate Net Profit
373.10
445.30
-16.21%
Operating Profit Margin (Excl OI)
12.86%
15.42%
-2.56%
Values in Rs Cr.
Direction Arrows
Net Sales

YoY Growth in nine months ended Dec 2025 is -2.02% vs 3.12% in Dec 2024

Direction Arrows
Consolidated Net Profit

YoY Growth in nine months ended Dec 2025 is -16.21% vs -9.79% in Dec 2024

Annual Results Snapshot (Consolidated) - Mar'25stock-summary

Mar'25
Mar'24
Change(%)
Net Sales
7,360.40
7,147.20
2.98%
Operating Profit (PBDIT) excl Other Income
1,143.30
1,302.80
-12.24%
Interest
92.80
116.00
-20.00%
Exceptional Items
0.00
-67.60
100.00%
Consolidate Net Profit
615.70
682.80
-9.83%
Operating Profit Margin (Excl OI)
15.53%
18.23%
-2.70%
Values in Rs Cr.
Direction Arrows
Net Sales

YoY Growth in year ended Mar 2025 is 2.98% vs 18.81% in Mar 2024

Direction Arrows
Consolidated Net Profit

YoY Growth in year ended Mar 2025 is -9.83% vs 32.74% in Mar 2024

stock-summaryCompany CV
About Cyient Ltd. stock-summary
stock-summary
Cyient Ltd.
Small Cap
Computers - Software & Consulting
Cyient Limited (Formerly known as Infotech Enterprises Ltd) was incorporated in the year 1991. The Company is engaged in providing global technology services and solutions specialising in geospatial, engineering design, IT solutions and data analytics. Having its headquarters and development facilities in India, Company serves a global customer base through its subsidiaries in the United States of America (USA), United Kingdom (UK), Germany, Japan, Australia, Singapore and India.
Company Coordinates stock-summary
Company Details
4th Floor A-Wing Plot No 11, Software Unit Layout Madhapur Hyderabad Telangana : 500081
stock-summary
Tel: 91-40-67641000/67641696/23124006
stock-summary
company.secretary@cyient.com
Registrar Details
Karvy Computershare Pvt Ltd, Plot No 17-24 , Near Image Hospital,, Reliance Cybervilae,Vithalrao Nagar,, Madhapur, Hyderabad