Apollo Sindoori

  • Market Cap: Micro Cap
  • Industry: Hotels & Resorts
  • ISIN: INE451F01024
  • NSEID: APOLSINHOT
  • BSEID:
INR
1,184.70
-5.3 (-0.45%)
BSENSE

Aug 19, 03:30 PM

BSE+NSE Vol: 276

  • Price Points
  • Score
  • Mojo Parameters
  • Total Return
  • News and Corporate Actions
  • Key factors
  • Shareholding
  • Financials
  • CompanyCV
stock-summaryPrice Point
High/Low

1Day

52 Week

Valuation
Technical
Day's Volume

CASH

276.0 (-65.96%) Volume

Shareholding (Jun 2026)

FII

0.00%

Held by 0 FIIs

DII

0.00%

Held by 0 DIIs

Promoter

64.68%

Why is Apollo Sindoori Hotels Ltd falling/rising?

20-Aug-2026

As of 19-Aug, Apollo Sindoori Hotels Ltd's stock price is at 1,184.70, down 0.45%, and has declined 3.35% over the past week. The stock is trading below its moving averages, indicating a bearish trend, with a year-to-date decline of 2.03%, underperforming the benchmark Sensex.

As of 19-Aug, Apollo Sindoori Hotels Ltd's stock price is falling, currently at 1,184.70, which reflects a decrease of 5.3 or 0.45%. The stock has underperformed compared to the sector by 1.02% today. Over the past week, the stock has declined by 3.35%, and it has also shown a negative trend over the past month and year, with declines of 4.89% and 16.64%, respectively. <BR><BR>Additionally, the stock is trading lower than its moving averages across various periods, including the 5-day, 20-day, 50-day, 100-day, and 200-day moving averages, indicating a bearish trend. Although there has been a rise in investor participation, with delivery volume increasing by 26.91% against the 5-day average, this has not been sufficient to counteract the overall downward movement in the stock price. The year-to-date performance shows a decline of 2.03%, while the stock has significantly underperformed the benchmark Sensex, which has seen a decline of 7.85% over the same period.

View full answer

Who are in the management team of Apollo Sindoori?

14-Aug-2026

The management team of Apollo Sindoori includes P Vijaya Kumar Reddy (Director), Sucharitha Reddy (Managing Director), Sindoori Reddy (Director), Suneeta Reddy (Director), Suresh R Madhok (Independent Director), G Venkataraman (Chairman & Independent Director), George Eapen (Independent Director), C Natarajan (Whole Time Director & CEO), and Surabhi Pasari (Company Secretary). They are responsible for the company's strategic direction and operations.

The management team of Apollo Sindoori includes the following key members:<BR><BR>1. **P Vijaya Kumar Reddy** - Director<BR>2. **Sucharitha Reddy** - Managing Director<BR>3. **Sindoori Reddy** - Director<BR>4. **Suneeta Reddy** - Director<BR>5. **Suresh R Madhok** - Independent Director<BR>6. **G Venkataraman** - Chairman & Independent Director<BR>7. **George Eapen** - Independent Director<BR>8. **C Natarajan** - Whole Time Director & CEO<BR>9. **Surabhi Pasari** - Company Secretary<BR><BR>This team plays a crucial role in guiding the company's strategic direction and operations.

View full answer

What does Apollo Sindoori do?

14-Aug-2026

Apollo Sindoori Hotels Ltd operates in the Hotels & Resorts industry, managing food outlets at hospitals and providing outdoor catering services. As of June 2026, it reported net sales of 178 Cr and a net profit of 2 Cr, with a market cap of INR 319 Cr.

Overview:<BR>Apollo Sindoori Hotels Ltd operates in the Hotels & Resorts industry, focusing on managing food outlets at hospitals and providing outdoor catering services, categorized as a micro-cap company.<BR><BR>History:<BR>Incorporated on November 3, 1998, Apollo Sindoori Hotels Ltd transitioned to being listed on the National Stock Exchange during FY 2016-17 after the closure of the Madras Stock Exchange. The latest quarterly results reported net sales and profit for June 2026.<BR><BR>Financial Snapshot:<BR>Net Sales: 178 Cr (Quarterly Results - Jun 2026) <BR>Net Profit: 2 Cr (Quarterly Results - Jun 2026) <BR>Market Cap: INR 319 Cr (Micro Cap)<BR><BR>Key Metrics:<BR>P/E: 35.00 <BR>Industry P/E: 36 <BR>Dividend Yield: 0.16% <BR>Debt Equity: -0.13 <BR>Return on Equity: 7.78% <BR>Price to Book: 2.03<BR><BR>Contact Details:<BR>Address: No16 Apollo Annex Building 1st, Floor Wallance Garden 1st Stre Chennai Tamil Nadu : 600006 <BR>Tel: 91-44-49045000 <BR>Email: info@apollosindoori.com <BR>Website: http://www.apollosindoori.com

View full answer

Who are the peers of the Apollo Sindoori?

14-Aug-2026

Apollo Sindoori's peers include Advani Hotels, HLV, Sinclairs Hotels, Robust Hotels, Asian Hotels (E), Grand Continent, Sayaji (Indore), and Emerald Leisures. In terms of management risk, growth, and capital structure, Advani Hotels and Sinclairs Hotels perform best, while HLV shows the lowest returns.

Peers: The peers of Apollo Sindoori are Advani Hotels., HLV, Sinclairs Hotels, Robust Hotels, Asian Hotels (E), Grand Continent, Sayaji (Indore), and Emerald Leisures.<BR><BR>Quality Snapshot: Excellent management risk is observed at Advani Hotels. and Sinclairs Hotels, while Below Average management risk is found at HLV, Apollo Sindoori, Robust Hotels, and Sayaji (Indore). Growth is Excellent at Advani Hotels. and Sinclairs Hotels, while Average growth is noted at HLV and Asian Hotels (E), and Good growth is seen at Robust Hotels. Capital Structure is Excellent at Sayaji (Indore), Good at Apollo Sindoori and Grand Continent, while Below Average is found at Robust Hotels and Asian Hotels (E).<BR><BR>Return Snapshot: Advani Hotels. has the highest 1-year return at -10.07%, while HLV has the lowest at -41.92%. Apollo Sindoori's 1-year return of -15.39% is better than HLV's but worse than Advani Hotels. Additionally, the six-month returns for HLV, Sinclairs Hotels, Robust Hotels, Grand Continent, and Asian Hotels (E) are all negative.

View full answer

How big is Apollo Sindoori?

14-Aug-2026

As of 14th August, Apollo Sindoori Hotels Ltd has a market capitalization of 323.00 Cr, with net sales of 671.64 Cr and a net profit of 8.32 Cr reported in the latest four quarters.

As of 14th August, Apollo Sindoori Hotels Ltd has a market capitalization of 323.00 Cr, categorizing it as a Micro Cap company.<BR><BR>In the latest four quarters, Apollo Sindoori reported net sales of 671.64 Cr and a net profit of 8.32 Cr.<BR><BR>The latest annual period for the balance sheet is March 2025, with shareholder's funds amounting to 146.01 Cr and total assets valued at 307.52 Cr.

View full answer

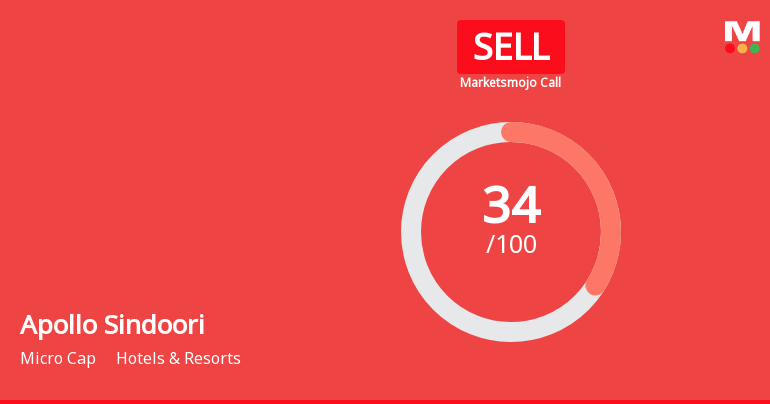
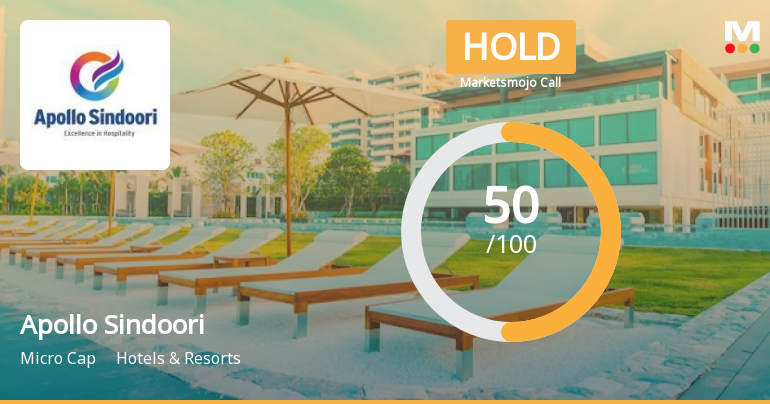
Should I buy, sell or hold Apollo Sindoori Hotels Ltd?

13-Aug-2026

Are Apollo Sindoori Hotels Ltd latest results good or bad?

29-May-2026

Apollo Sindoori Hotels Ltd's latest results show strong revenue growth, with a 256.58% increase in net profit and a 32.08% rise in net sales. However, declining operating margins and rising employee costs raise concerns about the sustainability of profitability, suggesting investors should proceed with caution.

Apollo Sindoori Hotels Ltd's latest results present a mixed picture. On the positive side, the company reported a significant increase in net profit for Q4 FY26, reaching ₹2.71 crore, which is a remarkable 256.58% increase quarter-on-quarter and a 25.46% increase year-on-year. Additionally, net sales grew to ₹182.35 crore, reflecting a 12.98% increase from the previous quarter and a robust 32.08% increase compared to the same quarter last year.<BR><BR>However, there are notable concerns regarding profitability. The operating margin decreased to 4.61%, down 133 basis points from the previous quarter, indicating challenges in maintaining operational efficiency despite revenue growth. Employee costs have surged, consuming 60.53% of net sales, which raises concerns about the sustainability of margins. Furthermore, the effective tax rate of 43.54% significantly impacts net profitability.<BR><BR>Overall, while the revenue growth is commendable, the declining margins and rising costs suggest that the company faces significant operational challenges that could hinder its ability to sustain profitability moving forward. Investors should approach with caution, considering both the strong revenue growth and the underlying profitability issues.

View full answer

Is Apollo Sindoori overvalued or undervalued?

18-Nov-2025

As of November 17, 2025, Apollo Sindoori's valuation has improved to attractive, indicating it is currently undervalued with a PE ratio of 30.60, favorable compared to peers like Indian Hotels Co and ITC Hotels, despite a year-to-date return of -23.78% against the Sensex's 10.02%.

As of 17 November 2025, the valuation grade for Apollo Sindoori has moved from fair to attractive, indicating a positive shift in its valuation outlook. The company is currently considered undervalued. Key ratios include a PE ratio of 30.60, an EV to EBITDA of 17.36, and a PEG ratio of 1.47, which suggest that the stock is priced favorably compared to its earnings growth potential.<BR><BR>In comparison to its peers, Apollo Sindoori's valuation appears more reasonable, especially when contrasted with Indian Hotels Co, which has a PE ratio of 61.02, and ITC Hotels, with a PE ratio of 62.61. Despite recent underperformance against the Sensex, with a year-to-date return of -23.78% compared to the Sensex's 10.02%, the attractive valuation suggests potential for recovery as market conditions improve.

View full answer

How has been the historical performance of Apollo Sindoori?

14-Nov-2025

Apollo Sindoori's historical performance shows increasing net sales from 165.43 Cr in Mar'19 to 541.79 Cr in Mar'25, but profitability has declined, with profit after tax dropping from 16.92 Cr in Mar'23 to 7.72 Cr in Mar'25 and operating profit margins decreasing from 6.63% to 3.46%. Despite stable total liabilities and improved cash flow from operating activities to 21.00 Cr in Mar'25, the company ended with negative cash equivalents of -16.00 Cr.

Answer:<BR>The historical performance of Apollo Sindoori shows a trend of increasing net sales and operating income over the years, with net sales rising from 165.43 Cr in Mar'19 to 541.79 Cr in Mar'25. However, the company has faced fluctuations in profitability, with profit after tax peaking at 16.92 Cr in Mar'23 before declining to 7.72 Cr in Mar'25. The operating profit margin has also decreased from 6.63% in Mar'19 to 3.46% in Mar'25, indicating rising costs relative to sales. Total liabilities have remained relatively stable, with a slight decrease from 330.57 Cr in Mar'23 to 307.52 Cr in Mar'25. Cash flow from operating activities improved significantly to 21.00 Cr in Mar'25, compared to just 2.00 Cr in Mar'23, although the closing cash and cash equivalents remained negative at -16.00 Cr in Mar'25.<BR><BR>Breakdown:<BR>Apollo Sindoori's financial performance has demonstrated a consistent increase in net sales, which grew from 165.43 Cr in Mar'19 to 541.79 Cr in Mar'25, reflecting a strong upward trend in revenue generation. Operating income followed a similar trajectory, reaching 541.79 Cr in Mar'25. Despite this growth in sales, the company experienced a decline in profit after tax, which peaked at 16.92 Cr in Mar'23 but fell to 7.72 Cr in Mar'25, suggesting challenges in managing expenses. The operating profit margin has also decreased from 6.63% in Mar'19 to 3.46% in Mar'25, indicating that rising costs are impacting profitability. Total liabilities have shown stability, decreasing slightly from 330.57 Cr in Mar'23 to 307.52 Cr in Mar'25. On the cash flow front, the company improved its cash flow from operating activities to 21.00 Cr in Mar'25, a significant increase from 2.00 Cr in Mar'23, although it ended the period with negative cash and cash equivalents of -16.00 Cr.

View full answer

Who are the top shareholders of the Apollo Sindoori?

17-Jul-2025

The top shareholders of Apollo Sindoori include Prathap C Reddy with 14.12%, individual investors with 22.13%, and Aditya Deorah at 3.98%. There are no pledged promoter holdings or mutual fund schemes involved.

The top shareholders of Apollo Sindoori include the promoters, with Prathap C Reddy holding the highest stake at 14.12%. Additionally, individual investors collectively own 22.13% of the shares. Among public shareholders, Aditya Deorah is notable with a holding of 3.98%. There are also three foreign institutional investors (FIIs) that hold a small percentage of 0.01%. Notably, there are no pledged promoter holdings or mutual fund schemes involved.

View full answer

What is the technical trend for Apollo Sindoori?

09-Jun-2025

As of May 12, 2025, Apollo Sindoori's technical trend is mildly bearish, with mixed signals from the MACD, moving averages, and Bollinger Bands indicating downward pressure.

As of 12 May 2025, the technical trend for Apollo Sindoori has changed from bearish to mildly bearish. The weekly MACD indicates a mildly bullish stance, while the monthly MACD is mildly bearish, suggesting mixed signals. The daily moving averages are mildly bearish, and both the weekly and monthly Bollinger Bands are bearish, indicating downward pressure. The KST shows a mildly bullish trend on the weekly but is mildly bearish on the monthly, further contributing to the mixed outlook. The OBV is also mildly bearish on both time frames. Overall, the current technical stance is mildly bearish, with key indicators such as the moving averages and Bollinger Bands driving this assessment.

View full answer

When is the next results date for Apollo Sindoori?

06-Jun-2025

No Upcoming Board Meetings

Has Apollo Sindoori declared dividend?

06-Jun-2025

Yes, Apollo Sindoori Hotels Ltd has declared a 10% dividend, amounting to ₹0.5 per share, with an ex-date of February 17, 2025. While the company has shown significant volatility in total returns, it has experienced substantial positive returns over longer periods despite recent negative performance.

Apollo Sindoori Hotels Ltd has declared a 10% dividend.<BR><BR>Dividend Details:<BR>- Percentage announced: 10%<BR>- Amount per share: 0.5<BR>- Ex-date: 17 Feb 25<BR><BR>Dividend Yield: 0.19%.<BR><BR>Total Returns by Period:<BR>In the last 6 months, the price return was -31.97%, the dividend return was 0.03%, resulting in a total return of -31.94%.<BR><BR>Over the past year, the price return was -16.36%, the dividend return was 0.16%, leading to a total return of -16.2%.<BR><BR>In the 2-year period, the price return was -11.39%, with a dividend return of 0.30%, resulting in a total return of -11.09%.<BR><BR>For the last 3 years, the price return was 98.4%, the dividend return was 0.92%, culminating in a total return of 99.32%.<BR><BR>In the 4-year period, the price return was 49.61%, the dividend return was 0.85%, leading to a total return of 50.46%.<BR><BR>Over the last 5 years, the price return was 182.31%, with a dividend return of 1.91%, resulting in a total return of 184.22%.<BR><BR>Overall, Apollo Sindoori has declared a dividend, but the total returns over various periods show significant volatility, with negative returns in the short term and substantial positive returns over longer periods.

View full answer
iScoreScore
Click here to find our call on this stock
Strong Sell
Sell
Hold
Buy
Strong Buy

Dashboard

1

Poor Management Efficiency with a low ROE of 8.72%

  • The company has been able to generate a Return on Equity (avg) of 8.72% signifying low profitability per unit of shareholders funds
2

The company is Net-Debt Free

 
3

Healthy long term growth as Operating profit has grown by an annual rate 41.52%

 
4

Negative results in Jun 26

5

With ROE of 7.8, it has a Attractive valuation with a 2 Price to Book Value

6

Majority shareholders : Promoters

 
7

Below par performance in long term as well as near term

stock-summaryMojo Parameters

Mojo Parameters

Loading Valuation Snapshot...

Stock DNA

stock-summary
Industry

Hotels & Resorts

stock-summary
Market cap

INR 308 Cr (Micro Cap)

stock-summary
P/E

33.00

stock-summary
Industry P/E

36

stock-summary
Dividend Yield

0.17%

stock-summary
Debt Equity

-0.13

stock-summary
Return on Equity

7.78%

stock-summary
Price to Book

1.97

Revenue and Profits:
Net Sales:
178 Cr
(Quarterly Results - Jun 2026)
Net Profit:
2 Cr
stock-summaryTotal Returns
Total Returns (Price + Dividend) stock-summary
Dividend Yield (0.17%)
TimePeriod
Price Return
Dividend Return
Total Return
3 Months
7.66%
0%
7.66%
6 Months
-6.91%
0%
-6.91%
1 Year
-16.64%
0.14%
-16.5%
2 Years
-18.31%
0.28%
-18.03%
3 Years
-17.17%
0%
-17.17%
4 Years
60.46%
0.83%
61.29%
5 Years
41.74%
1.09%
42.83%

Latest dividend: 2 per share ex-dividend date: Sep-18-2025

Risk Adjusted Returns v/s stock-summary
Returns Beta
Icon
Beta has not been calculated since enough price history is not available
stock-summaryNews & Corporate Actions

Announcements stock-summary

Apollo Sindoori Hotels Limited - Outcome of Board Meeting

13-Nov-2019 | Source : NSE

Apollo Sindoori Hotels Limited has informed the Exchange regarding Board meeting held on November 13, 2019.

Apollo Sindoori Hotels Limited - Updates

04-Nov-2019 | Source : NSE

Apollo Sindoori Hotels Limited has informed the Exchange regarding 'Pursuant to the SEBI Circular no. SEB1/HO/CFO/DCR1/CIR/P/2019/90 dated August 07, 2019 and the SEBI (Substantial Acquisition of Shares and Takeovers) Regulations. 2011, we have enclosed herewith the disclosure of reasons for encumbrance by the promoters and promoter group in respect of shares of Apollo Sindoori Hotels Limited.'.

Apollo Sindoori Hotels Limited - Updates

31-Oct-2019 | Source : NSE

Apollo Sindoori Hotels Limited has informed the Exchange regarding 'Certificate -74(5) of SEBI (Depository Participants Regulations,2018.'

Corporate Actions stock-summary

stock-summary
BOARD MEETING

No Upcoming Board Meetings

stock-summary
DIVIDEND

Apollo Sindoori Hotels Ltd has declared 40% dividend, ex-date: 18 Sep 25

stock-summary
SPLITS

Apollo Sindoori Hotels Ltd has announced 5:10 stock split, ex-date: 12 Oct 18

stock-summary
BONUS

No Bonus history available

stock-summary
RIGHTS

No Rights history available

stock-summaryKey Factors

Quality key factors stock-summary

Factor
Value
Sales Growth (5y)
29.87%
EBIT Growth (5y)
41.52%
EBIT to Interest (avg)
1.97
Debt to EBITDA (avg)
3.96
Net Debt to Equity (avg)
-0.13
Sales to Capital Employed (avg)
2.06
Tax Ratio
43.28%
Dividend Payout Ratio
8.42%
Pledged Shares
0
Institutional Holding
0
ROCE (avg)
9.29%
ROE (avg)
8.72%

Valuation key factors

Factor
Value
P/E Ratio
33
Industry P/E
Price to Book Value
1.96
EV to EBIT
17.45
EV to EBITDA
9.31
EV to Capital Employed
2.11
EV to Sales
0.43
PEG Ratio
NA
Dividend Yield
0.17%
ROCE (Latest)
11.89%
ROE (Latest)
7.78%

Technicals key factors

Indicator
Weekly
Monthly
MACD
Bearish
Bearish
RSI
No Signal
No Signal
Bollinger Bands
Bearish
Bearish
Moving Averages
Mildly Bullish (Daily)
KST
Bullish
Mildly Bullish
Dow Theory
Mildly Bullish
No Trend
OBV
Mildly Bullish
No Trend
stock-summary Technical Indicator Scale: Bearish, Mildly Bearish, Sideways, Mildly Bullish, Bullish  Turned 
stock-summaryShareholding
Shareholding Snapshot : Jun 2026stock-summary
Shareholding Compare (%holding) stock-summary
Majority shareholders

Promoters

Pledged Promoter Holdings

None

Mutual Funds

Held by 0 Schemes

FIIs

Held by 0 FIIs

Promoter with highest holding

Prathap C Reddy (14.12%)

Highest Public shareholder

Aditya Deorah (4.78%)

Individual Investors Holdings

21.63%

stock-summaryFinancial
[
  {
    "link": "quarterly",
    "btn_text": "All Quarterly Results",
    "header": "Quarterly Results Snapshot (Consolidated) - Jun'26 - QoQ",
    "rhs": [
      {
        "prefix": "Net Sales ",
        "suffix": "QoQ Growth in quarter ended Jun 2026 is -2.24% vs 12.98% in Mar 2026",
        "dir": -1
      },
      {
        "prefix": "Consolidated Net Profit ",
        "suffix": "QoQ Growth in quarter ended Jun 2026 is -35.06% vs 256.58% in Mar 2026",
        "dir": -1
      }
    ],
    "table": {
      "header": [
        "Jun'26",
        "Mar'26",
        "Change(%)"
      ],
      "body": [
        {
          "field": "Net Sales",
          "val1": "178.26",
          "val2": "182.35",
          "chgp": "-2.24%",
          "chgp_class": "negative"
        },
        {
          "field": "Operating Profit (PBDIT) excl Other Income",
          "val1": "6.30",
          "val2": "8.40",
          "chgp": "-25.00%",
          "chgp_class": "negative"
        },
        {
          "field": "Interest",
          "val1": "2.12",
          "val2": "2.28",
          "chgp": "-7.02%",
          "chgp_class": "positive"
        },
        {
          "field": "Exceptional Items",
          "val1": "1.82",
          "val2": "1.40",
          "chgp": "30.00%",
          "chgp_class": "positive"
        },
        {
          "field": "Consolidate Net Profit",
          "val1": "1.76",
          "val2": "2.71",
          "chgp": "-35.06%",
          "chgp_class": "negative"
        },
        {
          "field": "Operating Profit Margin (Excl OI)",
          "val1": "3.53%",
          "val2": "4.61%",
          "chgp": "-1.08%",
          "chgp_class": "negative"
        }
      ]
    }
  },
  {
    "link": "half-yearly",
    "btn_text": "All Half Yearly Results",
    "header": "Half Yearly Results Snapshot (Consolidated) - Sep'25",
    "rhs": [
      {
        "prefix": "Net Sales ",
        "suffix": " Growth in half year ended Sep 2025 is 9.58% vs 5.68% in Sep 2024",
        "dir": 1
      },
      {
        "prefix": "Consolidated Net Profit ",
        "suffix": " Growth in half year ended Sep 2025 is 89.76% vs -33.99% in Sep 2024",
        "dir": 1
      }
    ],
    "table": {
      "header": [
        "Sep'25",
        "Sep'24",
        "Change(%)"
      ],
      "body": [
        {
          "field": "Net Sales",
          "val1": "287.91",
          "val2": "262.75",
          "chgp": "9.58%",
          "chgp_class": "positive"
        },
        {
          "field": "Operating Profit (PBDIT) excl Other Income",
          "val1": "11.53",
          "val2": "10.74",
          "chgp": "7.36%",
          "chgp_class": "positive"
        },
        {
          "field": "Interest",
          "val1": "3.38",
          "val2": "4.23",
          "chgp": "-20.09%",
          "chgp_class": "positive"
        },
        {
          "field": "Exceptional Items",
          "val1": "0.00",
          "val2": "0.00",
          "chgp": "",
          "chgp_class": "neutral"
        },
        {
          "field": "Consolidate Net Profit",
          "val1": "7.04",
          "val2": "3.71",
          "chgp": "89.76%",
          "chgp_class": "positive"
        },
        {
          "field": "Operating Profit Margin (Excl OI)",
          "val1": "4.00%",
          "val2": "4.09%",
          "chgp": "-0.09%",
          "chgp_class": "negative"
        }
      ]
    }
  },
  {
    "link": "nine-monthly",
    "btn_text": "All Nine Monthly Results",
    "header": "Nine Monthly Results Snapshot (Consolidated) - Dec'25",
    "rhs": [
      {
        "prefix": "Net Sales ",
        "suffix": "YoY Growth in nine months ended Dec 2025 is 11.29% vs 5.11% in Dec 2024",
        "dir": 1
      },
      {
        "prefix": "Consolidated Net Profit ",
        "suffix": "YoY Growth in nine months ended Dec 2025 is 40.04% vs -40.36% in Dec 2024",
        "dir": 1
      }
    ],
    "table": {
      "header": [
        "Dec'25",
        "Dec'24",
        "Change(%)"
      ],
      "body": [
        {
          "field": "Net Sales",
          "val1": "449.31",
          "val2": "403.73",
          "chgp": "11.29%",
          "chgp_class": "positive"
        },
        {
          "field": "Operating Profit (PBDIT) excl Other Income",
          "val1": "21.12",
          "val2": "15.72",
          "chgp": "34.35%",
          "chgp_class": "positive"
        },
        {
          "field": "Interest",
          "val1": "5.44",
          "val2": "5.95",
          "chgp": "-8.57%",
          "chgp_class": "positive"
        },
        {
          "field": "Exceptional Items",
          "val1": "-4.13",
          "val2": "0.00",
          "chgp": "",
          "chgp_class": "neutral"
        },
        {
          "field": "Consolidate Net Profit",
          "val1": "7.80",
          "val2": "5.57",
          "chgp": "40.04%",
          "chgp_class": "positive"
        },
        {
          "field": "Operating Profit Margin (Excl OI)",
          "val1": "4.70%",
          "val2": "3.89%",
          "chgp": "0.81%",
          "chgp_class": "positive"
        }
      ]
    }
  },
  {
    "link": "annual",
    "btn_text": "All Annual Results",
    "header": "Annual Results Snapshot (Consolidated) - Mar'26",
    "rhs": [
      {
        "prefix": "Net Sales ",
        "suffix": "YoY Growth in year ended Mar 2026 is 16.59% vs 4.31% in Mar 2025",
        "dir": 1
      },
      {
        "prefix": "Consolidated Net Profit ",
        "suffix": "YoY Growth in year ended Mar 2026 is 36.01% vs -30.26% in Mar 2025",
        "dir": 1
      }
    ],
    "table": {
      "header": [
        "Mar'26",
        "Mar'25",
        "Change(%)"
      ],
      "body": [
        {
          "field": "Net Sales",
          "val1": "631.66",
          "val2": "541.79",
          "chgp": "16.59%",
          "chgp_class": "positive"
        },
        {
          "field": "Operating Profit (PBDIT) excl Other Income",
          "val1": "29.52",
          "val2": "18.72",
          "chgp": "57.69%",
          "chgp_class": "positive"
        },
        {
          "field": "Interest",
          "val1": "7.72",
          "val2": "7.62",
          "chgp": "1.31%",
          "chgp_class": "negative"
        },
        {
          "field": "Exceptional Items",
          "val1": "-2.74",
          "val2": "0.00",
          "chgp": "",
          "chgp_class": "neutral"
        },
        {
          "field": "Consolidate Net Profit",
          "val1": "10.50",
          "val2": "7.72",
          "chgp": "36.01%",
          "chgp_class": "positive"
        },
        {
          "field": "Operating Profit Margin (Excl OI)",
          "val1": "4.67%",
          "val2": "3.46%",
          "chgp": "1.21%",
          "chgp_class": "positive"
        }
      ]
    }
  }
]

Quarterly Results Snapshot (Consolidated) - Jun'26 - QoQstock-summary

Jun'26
Mar'26
Change(%)
Net Sales
178.26
182.35
-2.24%
Operating Profit (PBDIT) excl Other Income
6.30
8.40
-25.00%
Interest
2.12
2.28
-7.02%
Exceptional Items
1.82
1.40
30.00%
Consolidate Net Profit
1.76
2.71
-35.06%
Operating Profit Margin (Excl OI)
3.53%
4.61%
-1.08%
Values in Rs Cr.
Direction Arrows
Net Sales

QoQ Growth in quarter ended Jun 2026 is -2.24% vs 12.98% in Mar 2026

Direction Arrows
Consolidated Net Profit

QoQ Growth in quarter ended Jun 2026 is -35.06% vs 256.58% in Mar 2026

Half Yearly Results Snapshot (Consolidated) - Sep'25stock-summary

Sep'25
Sep'24
Change(%)
Net Sales
287.91
262.75
9.58%
Operating Profit (PBDIT) excl Other Income
11.53
10.74
7.36%
Interest
3.38
4.23
-20.09%
Exceptional Items
0.00
0.00
Consolidate Net Profit
7.04
3.71
89.76%
Operating Profit Margin (Excl OI)
4.00%
4.09%
-0.09%
Values in Rs Cr.
Direction Arrows
Net Sales

Growth in half year ended Sep 2025 is 9.58% vs 5.68% in Sep 2024

Direction Arrows
Consolidated Net Profit

Growth in half year ended Sep 2025 is 89.76% vs -33.99% in Sep 2024

Nine Monthly Results Snapshot (Consolidated) - Dec'25stock-summary

Dec'25
Dec'24
Change(%)
Net Sales
449.31
403.73
11.29%
Operating Profit (PBDIT) excl Other Income
21.12
15.72
34.35%
Interest
5.44
5.95
-8.57%
Exceptional Items
-4.13
0.00
Consolidate Net Profit
7.80
5.57
40.04%
Operating Profit Margin (Excl OI)
4.70%
3.89%
0.81%
Values in Rs Cr.
Direction Arrows
Net Sales

YoY Growth in nine months ended Dec 2025 is 11.29% vs 5.11% in Dec 2024

Direction Arrows
Consolidated Net Profit

YoY Growth in nine months ended Dec 2025 is 40.04% vs -40.36% in Dec 2024

Annual Results Snapshot (Consolidated) - Mar'26stock-summary

Mar'26
Mar'25
Change(%)
Net Sales
631.66
541.79
16.59%
Operating Profit (PBDIT) excl Other Income
29.52
18.72
57.69%
Interest
7.72
7.62
1.31%
Exceptional Items
-2.74
0.00
Consolidate Net Profit
10.50
7.72
36.01%
Operating Profit Margin (Excl OI)
4.67%
3.46%
1.21%
Values in Rs Cr.
Direction Arrows
Net Sales

YoY Growth in year ended Mar 2026 is 16.59% vs 4.31% in Mar 2025

Direction Arrows
Consolidated Net Profit

YoY Growth in year ended Mar 2026 is 36.01% vs -30.26% in Mar 2025

stock-summaryCompany CV
About Apollo Sindoori Hotels Ltd stock-summary

stock-summary
Apollo Sindoori Hotels Ltd
Micro Cap
Hotels & Resorts
Apollo Sindoori Hotels Limited was incorporated in November 03, 1998. The Company is in the business of managing food outlets at hospitals and reputed organisations. The Company also undertakes Outdoor Catering Services, skilled manpower to hospitals etc During FY 2016-17, the company got listed on National Stock Exchange after Madras Stock Exchange closed down the operation. Apollo Sindoori Hotels entered into an MOU dated July 14, 2006 with Faber Medi-Serve SDN.
Company Coordinates stock-summary
Company Details
No16 Apollo Annex Building 1st, Floor Wallance Garden 1st Stre Chennai Tamil Nadu : 600006
stock-summary
Tel: 91-44-49045000
stock-summary
info@apollosindoori.com
Registrar Details
Cameo Corporate Services Ltd , Subramanian Buildings No 1 , Club House Road, Chennai