
Compare Robust Hotels with Similar Stocks
Dashboard
Weak Long Term Fundamental Strength with an average Return on Capital Employed (ROCE) of 2.22%
- Poor long term growth as Net Sales has grown by an annual rate of 11.72% over the last 5 years
- Low ability to service debt as the company has a high Debt to EBITDA ratio of 3.08 times
Underperformed the market in the last 1 year
Total Returns (Price + Dividend) 
Robust Hotels for the last several years.
Risk Adjusted Returns v/s
Returns Beta

News

Robust Hotels Ltd is Rated Sell
Robust Hotels Ltd is rated Sell by MarketsMOJO, with this rating last updated on 01 June 2026. However, the analysis and financial metrics discussed below reflect the company’s current position as of 14 July 2026, providing investors with an up-to-date view of the stock’s fundamentals, valuation, financial trend, and technical outlook.
Read full news article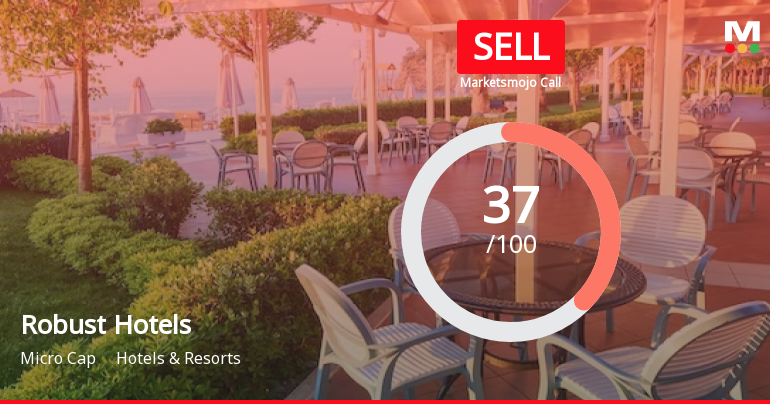
Robust Hotels Ltd is Rated Sell
Robust Hotels Ltd is rated Sell by MarketsMOJO, with this rating last updated on 01 June 2026. However, the analysis and financial metrics presented here reflect the stock's current position as of 03 July 2026, providing investors with the latest insights into the company’s performance and outlook.
Read full news article
Robust Hotels Ltd is Rated Sell
Robust Hotels Ltd is rated Sell by MarketsMOJO, with this rating last updated on 01 June 2026. However, the analysis and financial metrics discussed here reflect the company’s current position as of 22 June 2026, providing investors with the latest insights into the stock’s fundamentals, valuation, financial trends, and technical outlook.
Read full news article Announcements
Corporate Actions

No Upcoming Board Meetings

No Dividend history available

No Splits history available

No Bonus history available

No Rights history available
Quality key factors
Valuation key factors
Technicals key factors
 Technical Indicator Scale: Bearish, Mildly Bearish, Sideways, Mildly Bullish, Bullish Turned
 Shareholding Snapshot : Mar 2026
Shareholding Compare (%holding)
Promoters
None
Held by 4 Schemes (0.0%)
Held by 2 FIIs (0.01%)
Saraf Industries Limited (41.9%)
Satishkumar Devkarandas Huf (0.3%)
19.14%
Quarterly Results Snapshot (Standalone) - Mar'26 - QoQ

QoQ Growth in quarter ended Mar 2026 is 3.97% vs 7.67% in Dec 2025
QoQ Growth in quarter ended Mar 2026 is 9.46% vs 21.23% in Dec 2025
Half Yearly Results Snapshot (Standalone) - Sep'25
Growth in half year ended Sep 2025 is 8.58% vs 20.17% in Sep 2024
Growth in half year ended Sep 2025 is 170.14% vs 1,927.78% in Sep 2024
Nine Monthly Results Snapshot (Standalone) - Dec'25
YoY Growth in nine months ended Dec 2025 is 11.70% vs 14.23% in Dec 2024

YoY Growth in nine months ended Dec 2025 is 174.11% vs 130.60% in Dec 2024
Annual Results Snapshot (Standalone) - Mar'26
YoY Growth in year ended Mar 2026 is 8.80% vs 11.29% in Mar 2025
YoY Growth in year ended Mar 2026 is 50.06% vs 247.26% in Mar 2025
About Robust Hotels Ltd

Company Coordinates


