Bengal & Assam

  • Market Cap: Small Cap
  • Industry: Non Banking Financial Company (NBFC)
  • ISIN: INE083K01017
  • NSEID: BENGALASM
  • BSEID: 533095
INR
6,155.50
-60 (-0.97%)
BSENSE

Sep 22, 10:06 AM

BSE+NSE Vol: 25

  • Price Points
  • Score
  • Mojo Parameters
  • Total Return
  • News and Corporate Actions
  • Key factors
  • Shareholding
  • Financials
  • CompanyCV
stock-summaryPrice Point
High/Low

1Day

52 Week

Valuation
Technical
Day's Volume

CASH

25 (101.61%) Volume

Shareholding (Jun 2026)

FII

4.41%

Held by 16 FIIs

DII

0.01%

Held by 1 DIIs

Promoter

72.87%

Why is Bengal & Assam Company Ltd falling/rising?

06-Sep-2026

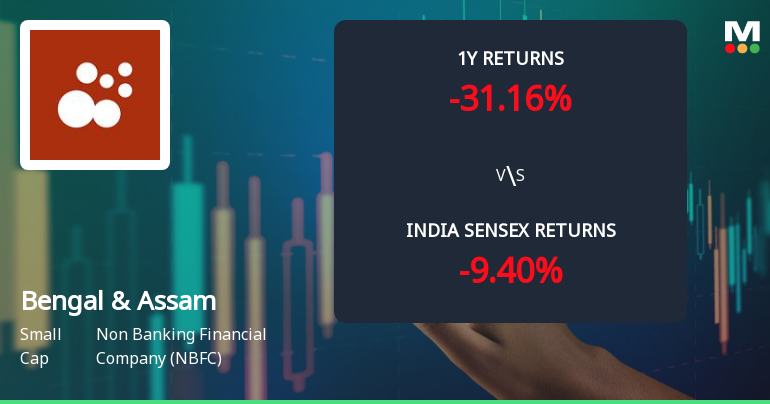
As of 05-Sep, Bengal & Assam Company Ltd's stock price is declining, currently at 6,310.95, influenced by poor financial performance and negative investor sentiment. The stock has underperformed its sector and shows bearish trends, with significant declines in net sales and profit after tax, raising concerns about its valuation and market confidence.

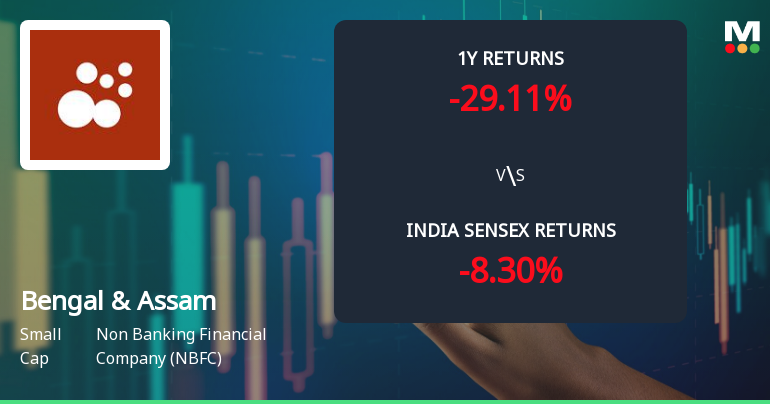
As of 05-Sep, Bengal & Assam Company Ltd's stock price is falling, currently at 6,310.95, which reflects a decrease of 113.9 points or 1.77%. This decline is influenced by several factors highlighted in the provided data.<BR><BR>The stock has underperformed its sector today by 3.43%, indicating a weaker performance relative to its peers. Additionally, the stock reached an intraday low of Rs 6262.1, marking a drop of 2.53%. Although the stock is trading higher than its 20-day moving average, it remains below the 5-day, 50-day, 100-day, and 200-day moving averages, suggesting a bearish trend in the short to medium term.<BR><BR>From a performance perspective, the stock has shown poor long-term growth, with net sales declining at an annual rate of 27.76% and operating profit decreasing by 21.10%. The company's profit after tax (PAT) for the quarter ending June 26 fell by 24.6%, further contributing to negative sentiment among investors. The debt-equity ratio is at its highest level of 0.06 times, which may raise concerns about financial stability.<BR><BR>Despite a strong long-term fundamental strength indicated by an average Return on Equity (ROE) of 12.28%, the stock's valuation appears expensive with a Price to Book Value ratio of 0.7. The stock has generated a return of -24.92% over the past year, while its profits have only increased by 6.7%, leading to a PEG ratio of 1.6, which suggests that the stock may not be a good value at its current price.<BR><BR>Moreover, domestic mutual funds hold only 0.01% of the company, which could indicate a lack of confidence in the stock's prospects. This underrepresentation may suggest that institutional investors are not comfortable with the current valuation or the business outlook.<BR><BR>Overall, the combination of poor financial performance, negative investor sentiment, and underwhelming market participation contributes to the stock's decline.

View full answer

Who are in the management team of Bengal & Assam?

01-Sep-2026

The management team of Bengal & Assam includes Bharat Hari Singhania (Chairman), Raghupati Singhania, Vinita Singhania, Ashok Kumar Kinra (Non Executive Directors), and several Independent Directors: Shailendra Swarup, Bakul Jain, Sanjay Kumar Khaitan, Sanjeev Kumar Jhunjhunwala, and Deepa Gopalan Wadhwa, along with Dilip Kumar Swain as Company Secretary. This diverse team oversees the company's governance and strategic direction.

The management team of Bengal & Assam includes the following members:<BR><BR>1. Bharat Hari Singhania - Chairman & Non Executive Director<BR>2. Raghupati Singhania - Non Executive Director<BR>3. Vinita Singhania - Non Executive Director<BR>4. Shailendra Swarup - Independent Director<BR>5. Bakul Jain - Independent Director<BR>6. Sanjay Kumar Khaitan - Independent Director<BR>7. Sanjeev Kumar Jhunjhunwala - Independent Director<BR>8. Deepa Gopalan Wadhwa - Independent Director<BR>9. Ashok Kumar Kinra - Non Executive Director<BR>10. Dilip Kumar Swain - Company Secretary & Compliance Officer<BR><BR>This team comprises a mix of executive and independent directors, contributing to the governance and strategic direction of the company.

View full answer

What does Bengal & Assam do?

01-Sep-2026

Bengal & Assam Company Ltd is a small-cap Non-Banking Financial Company (NBFC) focused on investment and finance, with a market cap of INR 7,185 Cr and reported net sales of 633 Cr and net profit of 187 Cr for June 2026. It operates under RBI guidelines and has key metrics including a P/E of 10.00 and a dividend yield of 0.79%.

Overview:<BR>Bengal & Assam Company Ltd is a small-cap Non-Banking Financial Company (NBFC) engaged in investment and finance activities.<BR><BR>History:<BR>The company was incorporated in 1947 in New Delhi. It operates under the guidelines issued by the RBI for NBFCs and the latest quarterly results reported net sales and profit for June 2026.<BR><BR>Financial Snapshot:<BR>Net Sales: 633 Cr (Quarterly Results - Jun 2026) <BR>Net Profit: 187 Cr (Quarterly Results - Jun 2026) <BR>Market Cap: INR 7,185 Cr (Small Cap)<BR><BR>Key Metrics:<BR>P/E: 10.00 <BR>Industry P/E: 21 <BR>Dividend Yield: 0.79% <BR>Debt-Equity: 0.06 <BR>Return on Equity: 7.78% <BR>Price to Book: 0.67 <BR><BR>Contact Details:<BR>Address: 7 Council House Street, Kolkata, West Bengal: 700001 <BR>Tel: 91-033-22486181 <BR>Email: dswain@jkmail.com <BR>Website: http://www.bengalassam.com

View full answer

Who are the peers of the Bengal & Assam?

01-Sep-2026

The peers of Bengal & Assam include Capri Global, Five-Star Bus.Fi, SBFC Finance, Religare Enterprises, Paisalo Digital, Fedbank Finance, MAS Financial Services, and Northern ARC. While Capri Global and SBFC Finance show excellent growth and management, Bengal & Assam has below-average growth and the lowest 1-year return among its peers at -21.52%.

Peers: The peers of Bengal & Assam are Capri Global, Five-Star Bus.Fi, SBFC Finance, Religare Enterp., Paisalo Digital, Fedbank Financi., MAS FINANC SER, and Northern ARC.<BR><BR>Quality Snapshot: Excellent management risk is observed at Capri Global, Five-Star Bus.Fi, SBFC Finance, and MAS FINANC SER, while Good management risk is found at Fedbank Financi. and Paisalo Digital. Average management risk is present at Bengal & Assam and Religare Enterp., and Below Average management risk is noted at Northern ARC. In terms of growth, Excellent growth is seen at Capri Global and SBFC Finance, Good growth is noted at Five-Star Bus.Fi, Paisalo Digital, Fedbank Financi., and MAS FINANC SER, while Bengal & Assam and Religare Enterp. show Below Average growth, and Northern ARC has Average growth. All peers maintain an Excellent capital structure.<BR><BR>Return Snapshot: The peer with the highest 1-year return is Paisalo Digital at 123.40%, while Bengal & Assam has the lowest at -21.52%. This indicates that Bengal & Assam's return is significantly lower than its peers. Additionally, Fedbank Financi. and MAS FINANC SER have negative six-month returns.

View full answer

How big is Bengal & Assam?

01-Sep-2026

As of 31st August, Bengal & Assam Company Ltd has a market capitalization of 7,185.00 Cr, with Net Sales of 2,436.68 Cr and a Net Profit of 762.46 Cr reported for the latest four quarters. Shareholder's Funds are 10,687.21 Cr and Total Assets are 12,425.99 Cr as of March 2026.

As of 31st August, Bengal & Assam Company Ltd has a market capitalization of 7,185.00 Cr, categorizing it as a Small Cap company.<BR><BR>In the latest four quarters, the company reported Net Sales of 2,436.68 Cr and a Net Profit of 762.46 Cr.<BR><BR>For the latest annual period ending in March 2026, Shareholder's Funds amounted to 10,687.21 Cr, while Total Assets were reported at 12,425.99 Cr.

View full answer

Should I buy, sell or hold Bengal & Assam Company Ltd?

15-Aug-2026

Are Bengal & Assam Company Ltd latest results good or bad?

13-Aug-2026

Bengal & Assam Company Ltd's latest results show mixed performance: while net profit increased 31.90% quarter-on-quarter and net sales grew 20.94% year-on-year, standalone profit before tax fell 61.72% year-on-year, raising concerns about operational efficiency and sustainability. Investors should be cautious due to declining profit margins and reliance on non-operating income.

Bengal & Assam Company Ltd's latest results present a mixed picture, with some concerning trends overshadowing the positive aspects. <BR><BR>On the positive side, the company reported a consolidated net profit of ₹203.04 crores for Q4 FY26, reflecting a 31.90% increase quarter-on-quarter, although it represents a decline of 9.02% year-on-year. Additionally, net sales grew significantly by 20.94% year-on-year to ₹630.17 crores, indicating strong revenue growth.<BR><BR>However, the standalone profit before tax, excluding other income, saw a dramatic decline of 61.72% year-on-year, falling to just ₹23.88 crores. This raises serious concerns about the sustainability of earnings growth and the quality of profitability. The operating margin also compressed sharply to 8.56%, down from 17.77% in the same quarter last year, highlighting operational inefficiencies.<BR><BR>Moreover, the company's return on equity (ROE) has deteriorated to 7.97%, which is below acceptable benchmarks for financial services companies. The heavy reliance on non-operating income, which constituted 45.17% of profit before tax, further complicates the outlook, suggesting that the core business may not be generating adequate returns.<BR><BR>Overall, while there are some positive indicators in terms of revenue growth, the significant declines in profit margins and operational performance raise red flags about the company's financial health and future sustainability. Investors should approach with caution, given the underlying challenges.

View full answer

When is the next results date for Bengal & Assam Company Ltd?

07-Aug-2026

The next results date for Bengal & Assam Company Ltd is 13 August 2026.

The next results date for Bengal & Assam Company Ltd is scheduled for 13 August 2026.

View full answer

Is Bengal & Assam technically bullish or bearish?

03-Dec-2025

As of December 2, 2025, the technical trend for Bengal & Assam has shifted to a bearish stance, supported by bearish signals from the weekly MACD, KST, and daily moving averages, despite some bullishness in the monthly RSI.

As of 2 December 2025, the technical trend has changed from mildly bearish to bearish. The current technical stance is bearish, with a moderate strength indicated by the weekly MACD and KST both being bearish. The daily moving averages also confirm a bearish outlook. While the monthly RSI shows bullishness, it is overshadowed by the bearish signals in the weekly timeframe. Overall, the combination of bearish indicators in the weekly and daily analyses suggests a prevailing bearish sentiment for Bengal & Assam.

View full answer

How has been the historical performance of Bengal & Assam?

17-Nov-2025

Bengal & Assam experienced significant declines in net sales, operating income, and profits from Mar'23 to Mar'25, with net sales dropping from 16,491.65 Cr to 2,127.90 Cr. Despite a temporary improvement in cash flow from operating activities, the overall financial performance indicates a challenging environment.

Answer:<BR>The historical performance of Bengal & Assam shows significant fluctuations in key financial metrics over the years.<BR><BR>Breakdown:<BR>Bengal & Assam's net sales have seen a drastic decline from 16,491.65 Cr in Mar'23 to 2,127.90 Cr in Mar'25, reflecting a challenging period for the company. Total operating income followed a similar trend, decreasing from 16,491.65 Cr in Mar'23 to 2,127.90 Cr in Mar'25. The total expenditure also dropped significantly from 14,903.03 Cr in Mar'23 to 1,726.72 Cr in Mar'25, indicating a substantial reduction in operational costs. Operating profit (PBDIT) decreased from 1,672.13 Cr in Mar'23 to 500.05 Cr in Mar'25, while profit before tax fell from 667.05 Cr in Mar'23 to 400.21 Cr in Mar'25. The profit after tax also declined from 452.80 Cr in Mar'23 to 299.18 Cr in Mar'25. Despite these declines, the consolidated net profit showed a decrease from 937.71 Cr in Mar'23 to 732.28 Cr in Mar'25. The company's total assets decreased from 17,225.97 Cr in Mar'23 to 11,336.39 Cr in Mar'25, while total liabilities also fell from 17,225.97 Cr in Mar'23 to 11,336.39 Cr in Mar'25. The cash flow from operating activities improved from 1,437.00 Cr in Mar'23 to 1,817.00 Cr in Mar'24, but the net cash outflow was recorded at -165.00 Cr in Mar'24. Overall, the financial data indicates a challenging environment for Bengal & Assam, with significant reductions in sales and profits over the observed period.

View full answer

Is Bengal & Assam overvalued or undervalued?

16-Sep-2025

As of September 15, 2025, Bengal & Assam is considered overvalued with a valuation grade of expensive, a PE ratio of 14.02, and an EV to EBITDA of 22.53, especially when compared to peers like Bajaj Finance at 36.1 and Life Insurance at 11.48, despite its strong stock performance relative to the Sensex.

As of 15 September 2025, the valuation grade for Bengal & Assam has moved from very expensive to expensive, indicating a shift in market perception. The company is currently considered overvalued. Key ratios include a PE ratio of 14.02, an EV to EBITDA of 22.53, and a ROCE of 16.53%. <BR><BR>When compared to peers, Bengal & Assam's PE ratio is significantly lower than Bajaj Finance, which stands at 36.1, while Life Insurance offers a more attractive valuation with a PE of 11.48. Despite its recent stock performance, which has outpaced the Sensex over three and five years, the current valuation suggests that the stock may not be a compelling investment at this price point.

View full answer

Who are the top shareholders of the Bengal & Assam?

17-Jul-2025

The top shareholders of Bengal & Assam include Hari Shankar Singhania Holdings Pvt. Ltd. with 23.34%, 19 foreign institutional investors holding 4.55%, and Edgefield Securities Limited as the largest public shareholder at 2.86%. Individual investors own 11.35% of the shares, with no pledged promoter holdings.

The top shareholders of Bengal & Assam include the promoters, with Hari Shankar Singhania Holdings Pvt. Ltd. holding the largest share at 23.34%. Additionally, there are 19 foreign institutional investors (FIIs) that collectively hold 4.55% of the company. The highest public shareholder is Edgefield Securities Limited, which owns 2.86%. Individual investors also have a significant stake, holding 11.35% of the shares. Overall, the majority of the shares are held by promoters, and there are no pledged promoter holdings.

View full answer

Has Bengal & Assam declared dividend?

06-Jun-2025

Bengal & Assam Company Ltd has declared a 400% dividend, amounting to 40 per share, with an ex-date of September 12, 2024. Recent total returns have been volatile, showing a -22.42% return over the last 6 months but a strong 512.52% return over the past 5 years.

Bengal & Assam Company Ltd has declared a 400% dividend.<BR><BR>Dividend Details:<BR>- Percentage announced: 400%<BR>- Amount per share: 40<BR>- Ex-date: 12 Sep 24<BR><BR>Dividend Yield: 0.54%.<BR><BR>Total Returns by Period:<BR>In the last 6 months, the price return was -22.42%, with a dividend return of 0%, resulting in a total return of -22.42%.<BR><BR>Over the past year, the price return was -9.44%, with a dividend return of 0.47%, leading to a total return of -8.97%.<BR><BR>In the 2-year period, the price return was 58.42%, the dividend return was 1.33%, culminating in a total return of 59.75%.<BR><BR>For the 3-year period, the price return was 188.77%, with a dividend return of 3.11%, resulting in a total return of 191.88%.<BR><BR>In the 4-year period, the price return was 370.34%, with a dividend return of 5.10%, leading to a total return of 375.44%.<BR><BR>Over the last 5 years, the price return was 506.58%, with a dividend return of 5.94%, resulting in a total return of 512.52%.<BR><BR>Overall, Bengal & Assam Company Ltd has declared a substantial dividend, but recent total returns have shown volatility, particularly in the shorter periods, indicating a mixed performance in the market.

View full answer
iScoreScore
Click here to find our call on this stock
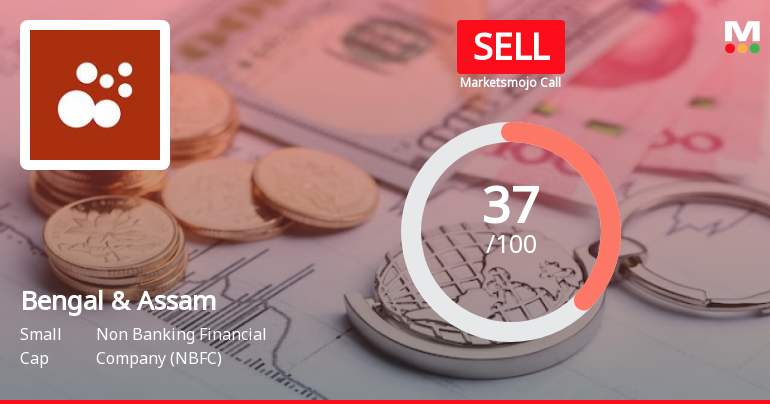
Strong Sell
Sell
Hold
Buy
Strong Buy

Dashboard

1

Poor long term growth as Net Sales has grown by an annual rate of -27.76% and Operating profit at -21.10%

 
2

Flat results in Jun 26

3

With ROE of 7.8, it has a Expensive valuation with a 0.7 Price to Book Value

4

Despite the size of the company, domestic mutual funds hold only 0.01% of the company

stock-summaryMojo Parameters

Mojo Parameters

Loading Valuation Snapshot...

Stock DNA

stock-summary
Industry

Non Banking Financial Company (NBFC)

stock-summary
Market cap

INR 7,020 Cr (Small Cap)

stock-summary
P/E

9.00

stock-summary
Industry P/E

20

stock-summary
Dividend Yield

1.61%

stock-summary
Debt Equity

0.06

stock-summary
Return on Equity

7.78%

stock-summary
Price to Book

0.66

Revenue and Profits:
Net Sales:
633 Cr
(Quarterly Results - Jun 2026)
Net Profit:
187 Cr
stock-summaryTotal Returns
Total Returns (Price + Dividend) stock-summary
Dividend Yield (1.61%)
TimePeriod
Price Return
Dividend Return
Total Return
3 Months
-2.44%
0.78%
-1.66%
6 Months
0%
0%
0.0%
1 Year
0%
0%
0.0%
2 Years
0%
0%
0.0%
3 Years
0%
0%
0.0%
4 Years
0%
0%
0.0%
5 Years
0%
0%
0.0%

Latest dividend: 49.84548454845485 per share ex-dividend date: Sep-01-2026

Risk Adjusted Returns v/s stock-summary
Returns Beta
Icon
Beta has not been calculated since enough price history is not available
stock-summaryNews & Corporate Actions

News

Announcements stock-summary

Icon
No announcement available

Corporate Actions stock-summary

stock-summary
BOARD MEETING

No Upcoming Board Meetings

stock-summary
DIVIDEND

Bengal & Assam Company Ltd has declared 500% dividend, ex-date: 01 Sep 26

stock-summary
SPLITS

No Splits history available

stock-summary
BONUS

No Bonus history available

stock-summary
RIGHTS

No Rights history available

stock-summaryKey Factors

Quality key factors stock-summary

Factor
Value
Sales Growth (5y)
-27.76%
EBIT Growth (5y)
-21.10%
Net Debt to Equity (avg)
0.06
Institutional Holding
4.42%
ROE (avg)
12.28%

Valuation key factors

Factor
Value
P/E Ratio
9
Industry P/E
9
Price to Book Value
0.66
EV to EBIT
24.05
EV to EBITDA
19.97
EV to Capital Employed
0.68
EV to Sales
3.12
PEG Ratio
1.63
Dividend Yield
1.61%
ROCE (Latest)
2.84%
ROE (Latest)
7.78%

Technicals key factors

Indicator
Weekly
Monthly
MACD
Mildly Bullish
Bearish
RSI
No Signal
No Signal
Bollinger Bands
Bearish
Bearish
Moving Averages
Bearish (Daily)
KST
Bearish
Bearish
Dow Theory
No Trend
Mildly Bullish
OBV
No Trend
No Trend
stock-summary Technical Indicator Scale: Bearish, Mildly Bearish, Sideways, Mildly Bullish, Bullish  Turned 
stock-summaryShareholding
Shareholding Snapshot : Jun 2026stock-summary
Shareholding Compare (%holding) stock-summary
Majority shareholders

Promoters

Pledged Promoter Holdings

None

Mutual Funds

Held by 7 Schemes (0.0%)

FIIs

Held by 16 FIIs (4.41%)

Promoter with highest holding

Hari Shankar Singhania Holdings Pvt. Ltd. (23.23%)

Highest Public shareholder

Edgefield Securities Limited (2.84%)

Individual Investors Holdings

11.5%

stock-summaryFinancial
[
  {
    "link": "quarterly",
    "btn_text": "All Quarterly Results",
    "header": "Quarterly Results Snapshot (Consolidated) - Jun'26 - YoY",
    "rhs": [
      {
        "prefix": "Net Sales ",
        "suffix": "YoY Growth in quarter ended Jun 2026 is 10.44% vs 8.58% in Jun 2025",
        "dir": 1
      },
      {
        "prefix": "Consolidated Net Profit ",
        "suffix": "YoY Growth in quarter ended Jun 2026 is -24.59% vs -0.39% in Jun 2025",
        "dir": -1
      }
    ],
    "table": {
      "header": [
        "Jun'26",
        "Jun'25",
        "Change(%)"
      ],
      "body": [
        {
          "field": "Net Sales",
          "val1": "632.96",
          "val2": "573.13",
          "chgp": "10.44%",
          "chgp_class": "positive"
        },
        {
          "field": "Operating Profit (PBDIT) excl Other Income",
          "val1": "98.24",
          "val2": "100.79",
          "chgp": "-2.53%",
          "chgp_class": "negative"
        },
        {
          "field": "Interest",
          "val1": "12.17",
          "val2": "12.49",
          "chgp": "-2.56%",
          "chgp_class": "positive"
        },
        {
          "field": "Exceptional Items",
          "val1": "0.00",
          "val2": "0.00",
          "chgp": "",
          "chgp_class": "neutral"
        },
        {
          "field": "Consolidate Net Profit",
          "val1": "186.60",
          "val2": "247.45",
          "chgp": "-24.59%",
          "chgp_class": "negative"
        },
        {
          "field": "Operating Profit Margin (Excl OI)",
          "val1": "15.52%",
          "val2": "17.59%",
          "chgp": "-2.07%",
          "chgp_class": "negative"
        }
      ]
    }
  },
  {
    "link": "half-yearly",
    "btn_text": "All Half Yearly Results",
    "header": "Half Yearly Results Snapshot (Consolidated) - Sep'25",
    "rhs": [
      {
        "prefix": "Net Sales ",
        "suffix": " Growth in half year ended Sep 2025 is 8.75% vs -87.03% in Sep 2024",
        "dir": 1
      },
      {
        "prefix": "Consolidated Net Profit ",
        "suffix": " Growth in half year ended Sep 2025 is 24.06% vs -39.20% in Sep 2024",
        "dir": 1
      }
    ],
    "table": {
      "header": [
        "Sep'25",
        "Sep'24",
        "Change(%)"
      ],
      "body": [
        {
          "field": "Net Sales",
          "val1": "1,215.51",
          "val2": "1,117.73",
          "chgp": "8.75%",
          "chgp_class": "positive"
        },
        {
          "field": "Operating Profit (PBDIT) excl Other Income",
          "val1": "291.92",
          "val2": "240.28",
          "chgp": "21.49%",
          "chgp_class": "positive"
        },
        {
          "field": "Interest",
          "val1": "25.50",
          "val2": "19.54",
          "chgp": "30.50%",
          "chgp_class": "negative"
        },
        {
          "field": "Exceptional Items",
          "val1": "0.00",
          "val2": "0.00",
          "chgp": "",
          "chgp_class": "neutral"
        },
        {
          "field": "Consolidate Net Profit",
          "val1": "466.34",
          "val2": "375.90",
          "chgp": "24.06%",
          "chgp_class": "positive"
        },
        {
          "field": "Operating Profit Margin (Excl OI)",
          "val1": "24.02%",
          "val2": "21.50%",
          "chgp": "2.52%",
          "chgp_class": "positive"
        }
      ]
    }
  },
  {
    "link": "nine-monthly",
    "btn_text": "All Nine Monthly Results",
    "header": "Nine Monthly Results Snapshot (Consolidated) - Dec'25",
    "rhs": [
      {
        "prefix": "Net Sales ",
        "suffix": "YoY Growth in nine months ended Dec 2025 is 8.70% vs -87.04% in Dec 2024",
        "dir": 1
      },
      {
        "prefix": "Consolidated Net Profit ",
        "suffix": "YoY Growth in nine months ended Dec 2025 is 21.93% vs -85.79% in Dec 2024",
        "dir": 1
      }
    ],
    "table": {
      "header": [
        "Dec'25",
        "Dec'24",
        "Change(%)"
      ],
      "body": [
        {
          "field": "Net Sales",
          "val1": "1,746.68",
          "val2": "1,606.83",
          "chgp": "8.70%",
          "chgp_class": "positive"
        },
        {
          "field": "Operating Profit (PBDIT) excl Other Income",
          "val1": "329.43",
          "val2": "308.57",
          "chgp": "6.76%",
          "chgp_class": "positive"
        },
        {
          "field": "Interest",
          "val1": "36.99",
          "val2": "30.85",
          "chgp": "19.90%",
          "chgp_class": "negative"
        },
        {
          "field": "Exceptional Items",
          "val1": "-10.26",
          "val2": "12.49",
          "chgp": "-182.15%",
          "chgp_class": "negative"
        },
        {
          "field": "Consolidate Net Profit",
          "val1": "620.27",
          "val2": "508.71",
          "chgp": "21.93%",
          "chgp_class": "positive"
        },
        {
          "field": "Operating Profit Margin (Excl OI)",
          "val1": "18.86%",
          "val2": "19.20%",
          "chgp": "-0.34%",
          "chgp_class": "negative"
        }
      ]
    }
  },
  {
    "link": "annual",
    "btn_text": "All Annual Results",
    "header": "Annual Results Snapshot (Consolidated) - Mar'26",
    "rhs": [
      {
        "prefix": "Net Sales ",
        "suffix": "YoY Growth in year ended Mar 2026 is 11.70% vs -83.53% in Mar 2025",
        "dir": 1
      },
      {
        "prefix": "Consolidated Net Profit ",
        "suffix": "YoY Growth in year ended Mar 2026 is 12.43% vs -81.18% in Mar 2025",
        "dir": 1
      }
    ],
    "table": {
      "header": [
        "Mar'26",
        "Mar'25",
        "Change(%)"
      ],
      "body": [
        {
          "field": "Net Sales",
          "val1": "2,376.85",
          "val2": "2,127.90",
          "chgp": "11.70%",
          "chgp_class": "positive"
        },
        {
          "field": "Operating Profit (PBDIT) excl Other Income",
          "val1": "383.35",
          "val2": "401.18",
          "chgp": "-4.44%",
          "chgp_class": "negative"
        },
        {
          "field": "Interest",
          "val1": "50.49",
          "val2": "43.86",
          "chgp": "15.12%",
          "chgp_class": "negative"
        },
        {
          "field": "Exceptional Items",
          "val1": "-9.77",
          "val2": "12.49",
          "chgp": "-178.22%",
          "chgp_class": "negative"
        },
        {
          "field": "Consolidate Net Profit",
          "val1": "823.31",
          "val2": "732.28",
          "chgp": "12.43%",
          "chgp_class": "positive"
        },
        {
          "field": "Operating Profit Margin (Excl OI)",
          "val1": "16.13%",
          "val2": "18.85%",
          "chgp": "-2.72%",
          "chgp_class": "negative"
        }
      ]
    }
  }
]

Quarterly Results Snapshot (Consolidated) - Jun'26 - YoYstock-summary

Jun'26
Jun'25
Change(%)
Net Sales
632.96
573.13
10.44%
Operating Profit (PBDIT) excl Other Income
98.24
100.79
-2.53%
Interest
12.17
12.49
-2.56%
Exceptional Items
0.00
0.00
Consolidate Net Profit
186.60
247.45
-24.59%
Operating Profit Margin (Excl OI)
15.52%
17.59%
-2.07%
Values in Rs Cr.
Direction Arrows
Net Sales

YoY Growth in quarter ended Jun 2026 is 10.44% vs 8.58% in Jun 2025

Direction Arrows
Consolidated Net Profit

YoY Growth in quarter ended Jun 2026 is -24.59% vs -0.39% in Jun 2025

Half Yearly Results Snapshot (Consolidated) - Sep'25stock-summary

Sep'25
Sep'24
Change(%)
Net Sales
1,215.51
1,117.73
8.75%
Operating Profit (PBDIT) excl Other Income
291.92
240.28
21.49%
Interest
25.50
19.54
30.50%
Exceptional Items
0.00
0.00
Consolidate Net Profit
466.34
375.90
24.06%
Operating Profit Margin (Excl OI)
24.02%
21.50%
2.52%
Values in Rs Cr.
Direction Arrows
Net Sales

Growth in half year ended Sep 2025 is 8.75% vs -87.03% in Sep 2024

Direction Arrows
Consolidated Net Profit

Growth in half year ended Sep 2025 is 24.06% vs -39.20% in Sep 2024

Nine Monthly Results Snapshot (Consolidated) - Dec'25stock-summary

Dec'25
Dec'24
Change(%)
Net Sales
1,746.68
1,606.83
8.70%
Operating Profit (PBDIT) excl Other Income
329.43
308.57
6.76%
Interest
36.99
30.85
19.90%
Exceptional Items
-10.26
12.49
-182.15%
Consolidate Net Profit
620.27
508.71
21.93%
Operating Profit Margin (Excl OI)
18.86%
19.20%
-0.34%
Values in Rs Cr.
Direction Arrows
Net Sales

YoY Growth in nine months ended Dec 2025 is 8.70% vs -87.04% in Dec 2024

Direction Arrows
Consolidated Net Profit

YoY Growth in nine months ended Dec 2025 is 21.93% vs -85.79% in Dec 2024

Annual Results Snapshot (Consolidated) - Mar'26stock-summary

Mar'26
Mar'25
Change(%)
Net Sales
2,376.85
2,127.90
11.70%
Operating Profit (PBDIT) excl Other Income
383.35
401.18
-4.44%
Interest
50.49
43.86
15.12%
Exceptional Items
-9.77
12.49
-178.22%
Consolidate Net Profit
823.31
732.28
12.43%
Operating Profit Margin (Excl OI)
16.13%
18.85%
-2.72%
Values in Rs Cr.
Direction Arrows
Net Sales

YoY Growth in year ended Mar 2026 is 11.70% vs -83.53% in Mar 2025

Direction Arrows
Consolidated Net Profit

YoY Growth in year ended Mar 2026 is 12.43% vs -81.18% in Mar 2025

stock-summaryCompany CV
About Bengal & Assam Company Ltd stock-summary
stock-summary
Bengal & Assam Company Ltd
Small Cap
Non Banking Financial Company (NBFC)
Bengal & Assam Company Limited was incorporated in year 1947 at New Delhi. As a Core Investment Company, the Company is holding investments in its subsidiaries, other group companies, money market mutual funds and carries out only such activities as are permitted under the guidelines issued by RBI for NBFCs. The Company is engaged in the investment and finance business. It operates in four segments: investment (shares/securities/funding), polymers, cotton yarn and dairy products.
Company Coordinates stock-summary
Company Details
7 Council House Street , Kolkata West Bengal : 700001
stock-summary
Tel: 91-033-22486181
stock-summary
dswain@jkmail.com
Registrar Details
Alankit Assignments Ltd , Alankit House , 2 E/21, Jhandewala Extension, New Delhi