
Compare Paisalo Digital with Similar Stocks
Dashboard
Strong Long Term Fundamental Strength with a 23.38% CAGR growth in Operating Profits
Healthy long term growth as Net Sales has grown by an annual rate of 22.22% and Operating profit at 23.38%
Positive results in Mar 26
With ROE of 13.3, it has a Fair valuation with a 3.6 Price to Book Value
High Institutional Holdings at 24.38%
Market Beating performance in long term as well as near term
Stock DNA
Non Banking Financial Company (NBFC)
INR 6,150 Cr (Small Cap)
27.00
21
0.17%
2.43
13.26%
3.00
Total Returns (Price + Dividend) 
Latest dividend: 0.1 per share ex-dividend date: Sep-22-2025
Risk Adjusted Returns v/s
Returns Beta

News

Paisalo Digital Ltd Locks at Upper Circuit With 20% Gain — Buyers Queue, Sellers Absent
At Rs 70.92, the buying was done — not because demand dried up, but because the exchange wouldn't let the stock go any higher. Paisalo Digital Ltd locked at its upper circuit of 20% on 30 Jun 2026, with buyers queuing and no sellers willing to part with shares.
Read full news article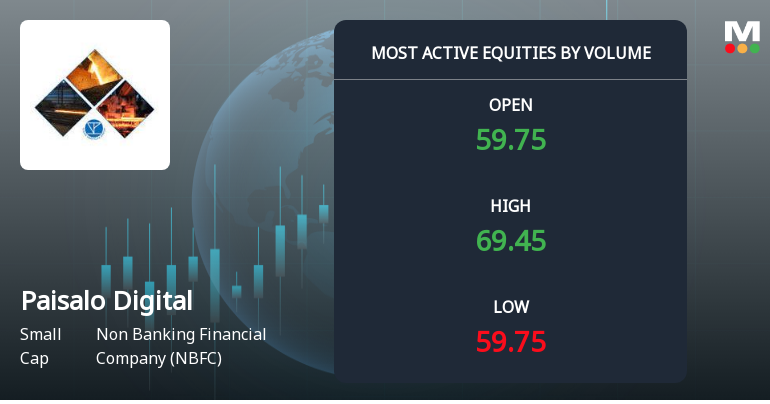
Paisalo Digital Ltd Surges on Exceptional Volume Amid NBFC Sector Volatility
Paisalo Digital Ltd, a small-cap player in the Non Banking Financial Company (NBFC) sector, witnessed a remarkable surge in trading volume and price on 1 July 2026, signalling robust investor interest and accumulation. The stock outperformed its sector and broader market indices, hitting a new 52-week high amid heightened volatility and liquidity.
Read full news article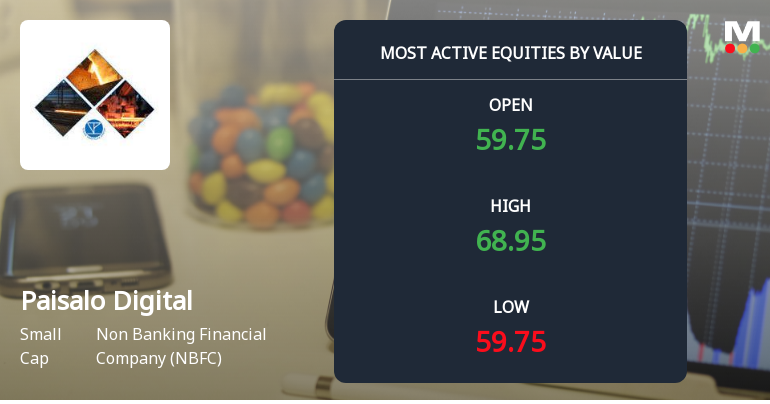
Paisalo Digital Ltd Surges on Record High Turnover and Institutional Interest
Paisalo Digital Ltd, a small-cap player in the Non Banking Financial Company (NBFC) sector, witnessed a remarkable surge in trading activity on 1 July 2026, driven by substantial value turnover and heightened institutional participation. The stock soared to a new 52-week high, outperforming its sector and broader market indices amid robust volume and volatility.
Read full news article Announcements
Paisalo Digital Limited - Other General Purpose
04-Nov-2019 | Source : NSEPaisalo Digital Limited has informed the Exchange regarding Disclosure of Related Party Transaction for the period ended on 30.09.2019, pursuant to regulation 23(9) of the SEBI (LODR) Regulations, 2015.
Paisalo Digital Limited - Updates
25-Oct-2019 | Source : NSEPaisalo Digital Limited has informed the Exchange regarding 'Signing of Co-origination Loan Agreement with Bank of India'.
Paisalo Digital Limited - Appointment
16-Oct-2019 | Source : NSEPaisalo Digital Limited has informed the Exchange regarding Appointment of Mr Raman Aggarwal as Non- Executive Independent Director of the company w.e.f. October 15, 2019.
Corporate Actions

No Upcoming Board Meetings

Paisalo Digital Ltd has declared 10% dividend, ex-date: 22 Sep 25

Paisalo Digital Ltd has announced 1:10 stock split, ex-date: 30 Jun 22

Paisalo Digital Ltd has announced 1:1 bonus issue, ex-date: 20 Mar 24

No Rights history available
Quality key factors
Valuation key factors
Technicals key factors
 Technical Indicator Scale: Bearish, Mildly Bearish, Sideways, Mildly Bullish, Bullish Turned
 Shareholding Snapshot : Mar 2026
Shareholding Compare (%holding)
Promoters
21.735
Held by 1 Schemes (0.0%)
Held by 53 FIIs (17.54%)
Equilibrated Venture Cflow Private Limited (20.53%)
Sbi Life Insurance Co. Ltd (6.83%)
15.27%
Quarterly Results Snapshot (Consolidated) - Mar'26 - QoQ

QoQ Growth in quarter ended Mar 2026 is 8.69% vs 7.16% in Dec 2025

QoQ Growth in quarter ended Mar 2026 is 9.01% vs 28.56% in Dec 2025
Half Yearly Results Snapshot (Consolidated) - Sep'25
Growth in half year ended Sep 2025 is 18.51% vs 33.01% in Sep 2024
Growth in half year ended Sep 2025 is 8.00% vs 6.40% in Sep 2024
Nine Monthly Results Snapshot (Consolidated) - Dec'25
YoY Growth in nine months ended Dec 2025 is 18.26% vs 24.57% in Dec 2024
YoY Growth in nine months ended Dec 2025 is 7.24% vs 8.06% in Dec 2024
Annual Results Snapshot (Consolidated) - Mar'26
YoY Growth in year ended Mar 2026 is 22.38% vs 17.06% in Mar 2025
YoY Growth in year ended Mar 2026 is 18.53% vs 11.82% in Mar 2025
About Paisalo Digital Ltd

Company Coordinates


