MAS FINANC SER

  • Market Cap: Small Cap
  • Industry: Non Banking Financial Company (NBFC)
  • ISIN: INE348L01012
  • NSEID: MASFIN
  • BSEID: 540749
INR
302.50
2.25 (0.75%)
BSENSE

Aug 21, 03:30 PM

BSE+NSE Vol: 1.09 lacs

  • Price Points
  • Score
  • Mojo Parameters
  • Total Return
  • News and Corporate Actions
  • Key factors
  • Shareholding
  • Financials
  • CompanyCV
stock-summaryPrice Point
High/Low

1Day

52 Week

Valuation
Technical
Day's Volume

CASH

1.09 lacs (-43.56%) Volume

Shareholding (Jun 2026)

FII

3.68%

Held by 90 FIIs

DII

19.68%

Held by 21 DIIs

Promoter

66.65%

Why is MAS Financial Services Ltd falling/rising?

21-Aug-2026

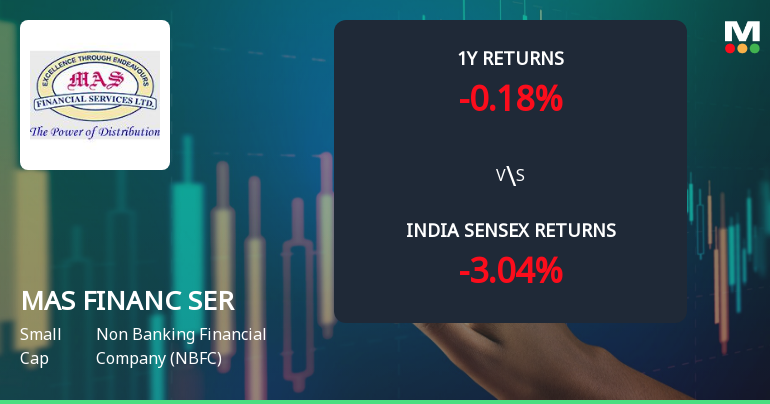
As of 20-Aug, MAS Financial Services Ltd's stock price is declining at 300.60, down 0.18% and underperforming against the Sensex. Despite recent price drops and trading below moving averages, there is increased investor interest, suggesting potential for future recovery.

As of 20-Aug, MAS Financial Services Ltd is experiencing a decline in its stock price, currently at 300.60, which reflects a change of -0.55 (-0.18%). The stock has been underperforming relative to the benchmark Sensex, with a performance of -0.86% over the past week compared to the Sensex's -0.69%. Over the last month, the stock has fallen by 5.56%, while the Sensex has only decreased by 0.22%. Year-to-date, MAS Financial Services has seen a decline of 6.96%, which is less severe than the Sensex's drop of 9.02%.<BR><BR>The stock has been on a downward trend, having lost value for three consecutive days, resulting in a total decline of 1.54% during this period. Additionally, MAS Financial Services is trading below its moving averages across various time frames, including the 5-day, 20-day, 50-day, 100-day, and 200-day averages, indicating a bearish trend.<BR><BR>Despite these negative indicators, there has been a notable increase in investor participation, with delivery volume rising by 164.08% on August 19 compared to the 5-day average. This suggests that while the stock price is currently falling, there is growing interest from investors, which could indicate potential for recovery in the future.<BR><BR>Overall, the combination of recent price declines, underperformance against benchmarks, and trading below moving averages contributes to the current downward movement of MAS Financial Services Ltd's stock price.

View full answer

Who are in the management team of MAS FINANC SER?

14-Aug-2026

The management team of MAS FINANC SER includes Kamlesh Chimanlal Gandhi (Chairman & Managing Director), Darshana Saumil Pandya (CEO), and several independent directors: Balabhaskaran, Chetan Ramniklal Shah, Umesh Rajanikant Shah, Daksha Niranjan Shah, and Narayanan Sadanandan, along with Riddhi Bhaveshbhai Bhayani as Company Secretary & Compliance Officer. They oversee the company's operations and strategic direction.

The management team of MAS FINANC SER includes the following individuals:<BR><BR>1. **Kamlesh Chimanlal Gandhi** - Chairman & Managing Director<BR>2. **Darshana Saumil Pandya** - Director & Chief Executive Officer<BR>3. **Balabhaskaran** - Independent Director<BR>4. **Chetan Ramniklal Shah** - Independent Director<BR>5. **Umesh Rajanikant Shah** - Independent Director<BR>6. **Riddhi Bhaveshbhai Bhayani** - Company Secretary & Compliance Officer<BR>7. **Daksha Niranjan Shah** - Independent Director<BR>8. **Narayanan Sadanandan** - Independent Director<BR><BR>This team is responsible for overseeing the operations and strategic direction of the company.

View full answer

What does MAS FINANC SER do?

14-Aug-2026

MAS Financial Services Ltd is a Gujarat-based NBFC focused on retail financing for lower and middle-income groups, with a market cap of INR 5,498 Cr and a net profit of 108 Cr as of June 2026. Key metrics include a P/E ratio of 14.00 and a debt-equity ratio of 3.47.

Overview:<BR>MAS Financial Services Ltd is a Gujarat-headquartered Non Banking Financial Company (NBFC) that specializes in providing retail financing services to lower and middle-income groups.<BR><BR>History:<BR>The company has been operational for more than two decades and is based in Ahmedabad. The latest quarterly results reported are for June 2026, showing net sales and profit figures.<BR><BR>Financial Snapshot:<BR>Net Sales: 562 Cr (Quarterly Results - Jun 2026) <BR>Net Profit: 108 Cr (Quarterly Results - Jun 2026) <BR>Market Cap: INR 5,498 Cr (Small Cap)<BR><BR>Key Metrics:<BR>P/E: 14.00 <BR>Industry P/E: 21 <BR>Dividend Yield: 0.62% <BR>Debt-Equity: 3.47 <BR>Return on Equity: 12.60% <BR>Price to Book: 1.86<BR><BR>Contact Details:<BR>Address: 6 Narayan Chambers Ground Flr, Behind Patang Hotel Ashram Road Ahmedabad Gujarat : 380009 <BR>Tel: 91-79-30016500 <BR>Email: secretarial@mas.co.in <BR>Website: http://www.mas.co.in

View full answer

Who are the peers of the MAS FINANC SER?

14-Aug-2026

Peers of MAS FINANC SER include Religare Enterprises, Bengal & Assam, Paisalo Digital, Fedbank Financial, Dhenu Buildcon, Northern ARC, and SG Finserve. MAS FINANC SER has a management risk rated as excellent, with a 1-year return of -1.54%, higher than Bengal & Assam but lower than Paisalo Digital's 125.45%.

Peers: The peers of MAS FINANC SER are Religare Enterp., Bengal & Assam, Paisalo Digital, Fedbank Financi., Dhenu Buildcon, Northern ARC, and SG Finserve.<BR><BR>Quality Snapshot: Excellent management risk is observed at Fedbank Financi. and MAS FINANC SER, while Average management risk is found at Religare Enterp., Bengal & Assam, Paisalo Digital, and Northern ARC. Below Average management risk is noted for SG Finserve, while Dhenu Buildcon does not qualify. Growth is rated as Good for Paisalo Digital, Fedbank Financi., and MAS FINANC SER, while Average growth is seen at Northern ARC, and Below Average growth is noted for Religare Enterp. and Bengal & Assam. Dhenu Buildcon does not qualify for growth. Excellent capital structure is present in all peers except Dhenu Buildcon, which does not qualify.<BR><BR>Return Snapshot: Paisalo Digital has the highest 1-year return at 125.45%, while Bengal & Assam has the lowest at -22.57%. MAS FINANC SER's 1-year return is -1.54%, which is higher than Bengal & Assam's but lower than Paisalo Digital's. Additionally, Dhenu Buildcon and MAS FINANC SER have negative six-month returns.

View full answer

How big is MAS FINANC SER?

14-Aug-2026

As of 14th August, MAS Financial Services Ltd has a market capitalization of 5,477.17 Cr, with recent net sales of 2,091.91 Cr and a net profit of 394.12 Cr over the last four quarters.

As of 14th August, <BR><BR>Market Cap: MAS Financial Services Ltd has a market capitalization of 5,477.17 Cr, categorizing it as a Small Cap company.<BR><BR>Recent Quarterly Performance: The sum of Net Sales for the latest 4 quarters is 2,091.91 Cr, while the sum of Net Profit for the same period is 394.12 Cr.<BR><BR>Balance Sheet Snapshot: The reporting period is March 2026, with Shareholder's Funds amounting to 2,974.21 Cr and Total Assets totaling 13,729.93 Cr.

View full answer

Are MAS Financial Services Ltd latest results good or bad?

30-Jul-2026

MAS Financial Services Ltd's latest results are positive, with a Q1 FY27 net profit of ₹108.46 crores, a 26.78% year-on-year increase, and net sales growth of 20.70%. Despite slight margin pressures, the company maintains a healthy PAT margin of 19.58% and a commendable ROE of 12.60%.

The latest results for MAS Financial Services Ltd are quite positive. In Q1 FY27, the company reported a net profit of ₹108.46 crores, which reflects a significant year-on-year increase of 26.78%. Additionally, net sales grew by 20.70% compared to the same quarter last year, indicating strong revenue growth.<BR><BR>The company has also maintained a healthy profit after tax (PAT) margin of 19.58%, which is an improvement from the previous year. Although there was a slight contraction in the operating profit margin due to rising interest costs, the overall financial performance demonstrates robust growth and effective cost management.<BR><BR>Moreover, the return on equity (ROE) stands at 12.60%, which is commendable for the NBFC sector, showcasing efficient capital utilization. Overall, MAS Financial Services appears to be navigating the competitive lending environment effectively, maintaining strong growth momentum, and demonstrating resilience despite some margin pressures.

View full answer

Should I buy, sell or hold MAS Financial Services Ltd?

30-Jul-2026

When is the next results date for MAS Financial Services Ltd?

23-Jul-2026

The next results date for MAS Financial Services Ltd is July 29, 2026.

The next results date for MAS Financial Services Ltd is scheduled for July 29, 2026.

View full answer

Has MAS Financial Services Ltd declared dividend?

30-Jan-2026

Yes, MAS Financial Services Ltd has declared a dividend of 12% (₹0.70 per share) with an ex-date of February 4, 2026. The company has shown positive total returns across most periods, with a 1-year total return of 27.19%.

MAS Financial Services Ltd has declared a dividend.<BR><BR>Dividend Details:<BR>- Percentage announced: 12%<BR>- Amount per share: 0.70<BR>- Ex-date: 04 Feb 26<BR><BR>Dividend Yield: 0.53%<BR><BR>Total Returns by Period:<BR>In the last 3 months, the price return was 4.56%, the dividend return was 0.37%, resulting in a total return of 4.93%.<BR><BR>Over the past 6 months, the price return was 4.8%, the dividend return was 0.63%, leading to a total return of 5.43%.<BR><BR>In the 1-year period, the price return was 26.05%, the dividend return was 1.14%, culminating in a total return of 27.19%.<BR><BR>For the 2-year period, the price return was -2.66%, the dividend return was 1.04%, resulting in a total return of -1.62%.<BR><BR>In the last 3 years, the price return was 26.51%, the dividend return was 3.04%, leading to a total return of 29.55%.<BR><BR>Over the past 4 years, the price return was 95.48%, the dividend return was 6.15%, culminating in a total return of 101.63%.<BR><BR>In the 5-year period, the price return was 11.15%, the dividend return was 5.24%, resulting in a total return of 16.39%.<BR><BR>Overall, MAS Financial Services Ltd has declared a significant dividend and has shown positive total returns across most periods, indicating a favorable performance for investors.

View full answer

Is MAS FINANC SER overvalued or undervalued?

05-Dec-2025

As of December 4, 2025, MAS FINANC SER is considered undervalued with a favorable PE ratio of 16.77 and an attractive valuation compared to peers, having outperformed the Sensex with a year-to-date return of 13.34%.

As of 4 December 2025, the valuation grade for MAS FINANC SER has moved from fair to attractive, indicating a positive shift in its perceived value. The company is currently considered undervalued, with a PE ratio of 16.77, an EV to EBITDA ratio of 10.71, and a PEG ratio of 0.84, suggesting that it is trading at a lower valuation compared to its growth prospects.<BR><BR>In comparison to its peers, MAS FINANC SER's valuation metrics stand out favorably. For instance, Bajaj Finance is deemed very expensive with a PE ratio of 34.9, while Life Insurance is classified as very attractive with a PE of 10.85. This highlights that MAS FINANC SER is positioned competitively within its industry. Additionally, the company's recent stock performance has outpaced the Sensex, with a year-to-date return of 13.34% compared to the Sensex's 9.12%, reinforcing the attractiveness of its current valuation.

View full answer

How has been the historical performance of MAS FINANC SER?

03-Dec-2025

MAS FINANC SER has shown consistent growth in net sales and profits, with net sales increasing from 690.24 Cr in March 2022 to 1,596.48 Cr in March 2025, and profit after tax rising from 161.20 Cr to 313.98 Cr in the same period, despite higher interest expenses and negative cash flow from operations. Total liabilities and assets both rose to 12,191.61 Cr by March 2025.

Answer:<BR>The historical performance of MAS FINANC SER shows a consistent growth trend in net sales and profits over the years, culminating in the fiscal year ending March 2025.<BR><BR>Breakdown:<BR>MAS FINANC SER has demonstrated significant growth in net sales, increasing from 690.24 Cr in March 2022 to 1,596.48 Cr in March 2025. The total operating income followed a similar trajectory, reaching 1,596.48 Cr in March 2025, up from 690.24 Cr in March 2022. Operating profit (PBDIT) also saw a rise, climbing to 1,189.41 Cr in March 2025 from 557.30 Cr in March 2022. However, interest expenses increased notably, reaching 762.80 Cr in March 2025, compared to 338.68 Cr in March 2022, impacting profit before tax, which was 421.01 Cr in March 2025, up from 216.55 Cr in March 2022. The profit after tax increased to 313.98 Cr in March 2025 from 161.20 Cr in March 2022. On the balance sheet, total liabilities rose to 12,191.61 Cr in March 2025 from 6,294.35 Cr in March 2022, while total assets increased to 12,191.61 Cr from 6,294.35 Cr in the same period. Cash flow from operating activities remained negative but improved to -1,133.00 Cr in March 2025 from -805.00 Cr in March 2022, while cash flow from financing activities surged to 2,197.00 Cr in March 2025, indicating strong financing support. Overall, MAS FINANC SER has shown robust growth in revenue and profits, despite rising interest costs and negative cash flow from operations.

View full answer

Is MAS FINANC SER technically bullish or bearish?

03-Oct-2025

As of October 1, 2025, the trend has shifted to mildly bullish, supported by daily moving averages, though caution is advised due to mixed signals from weekly indicators.

As of 1 October 2025, the technical trend has changed from sideways to mildly bullish. The current stance is mildly bullish, driven primarily by the daily moving averages indicating a bullish sentiment. However, the weekly MACD and KST are mildly bearish, suggesting some caution. The monthly indicators, including MACD and Bollinger Bands, are bullish, reinforcing the overall positive outlook. The RSI shows no signals, indicating a lack of momentum in either direction. Overall, while there are mixed signals in the weekly timeframe, the shift to a mildly bullish trend suggests a positive outlook in the short term.

View full answer

Who are the top shareholders of the MAS FINANC SER?

17-Jul-2025

The top shareholders of MAS FINANC SER include Shweta Kamlesh Gandhi with 27.01%, mutual funds with 12.86%, 82 foreign institutional investors holding 3.12%, and the Business Excellence Trust III at 6.69%, along with individual investors representing 7.66%.

The top shareholders of MAS FINANC SER include several key players. The majority shareholder is Shweta Kamlesh Gandhi, who holds 27.01% of the shares. Additionally, the company has mutual funds represented by six schemes, collectively holding 12.86%. There are also 82 foreign institutional investors (FIIs) with a combined holding of 3.12%. The highest public shareholder is the Business Excellence Trust III - India Business Excellence Fund III, which holds 6.69%. Individual investors account for 7.66% of the total holdings.

View full answer

What is the bonus history of the MAS FINANC SER?

06-Jun-2025

MAS Financial Services Ltd has announced a 2:1 bonus issue, with an ex-date and record date of February 22, 2024, meaning shareholders will receive two additional shares for every one share held as of that date.

MAS Financial Services Ltd has a recent bonus issue history that includes a 2:1 bonus announcement. The ex-date for this bonus is set for February 22, 2024, which is also the record date. This means that shareholders on record as of this date will receive two additional shares for every one share they currently hold. If you have any more questions about the company or its financial activities, feel free to ask!

View full answer
iScoreScore
Click here to find our call on this stock
Strong Sell
Sell
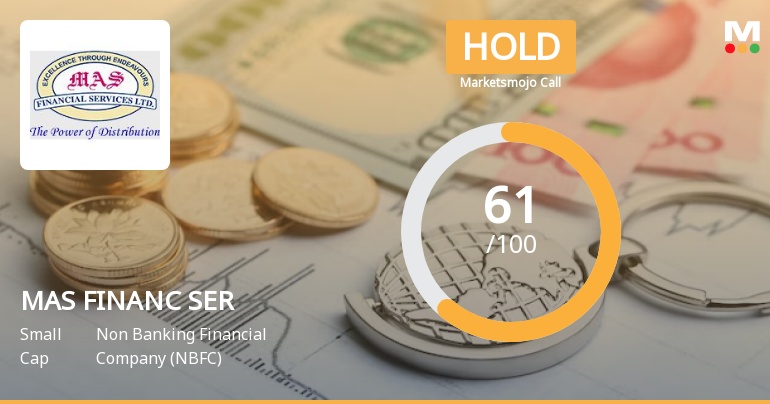
Hold
Buy
Strong Buy

Dashboard

1

Strong Long Term Fundamental Strength with a 25.00% CAGR growth in Operating Profits

 
2

Healthy long term growth as Operating profit has grown by an annual rate of 25.00%

 
3

With a growth in Net Profit of 27.21%, the company declared Very Positive results in Jun 26

4

With ROE of 12.6, it has a Attractive valuation with a 1.8 Price to Book Value

5

High Institutional Holdings at 23.37%

6

Below par performance in long term as well as near term

stock-summaryMojo Parameters

Mojo Parameters

Loading Valuation Snapshot...

Stock DNA

stock-summary
Industry

Non Banking Financial Company (NBFC)

stock-summary
Market cap

INR 5,470 Cr (Small Cap)

stock-summary
P/E

14.00

stock-summary
Industry P/E

21

stock-summary
Dividend Yield

0.63%

stock-summary
Debt Equity

3.47

stock-summary
Return on Equity

12.60%

stock-summary
Price to Book

1.84

Revenue and Profits:
Net Sales:
562 Cr
(Quarterly Results - Jun 2026)
Net Profit:
108 Cr
stock-summaryTotal Returns
Total Returns (Price + Dividend) stock-summary
Dividend Yield (0.63%)
TimePeriod
Price Return
Dividend Return
Total Return
3 Months
-1.14%
0.23%
-0.91%
6 Months
-9.0%
0.21%
-8.79%
1 Year
-3.14%
0.62%
-2.52%
2 Years
6.31%
1.42%
7.73%
3 Years
10.03%
1.74%
11.77%
4 Years
38.43%
2.38%
40.81%
5 Years
22.8%
2.78%
25.58%

Latest dividend: 1.2 per share ex-dividend date: Feb-04-2026

Risk Adjusted Returns v/s stock-summary
Returns Beta
Icon
Beta has not been calculated since enough price history is not available
stock-summaryNews & Corporate Actions

Announcements stock-summary

MAS Financial Services Limited - Updates

27-Nov-2019 | Source : NSE

MAS Financial Services Limited has informed the Exchange regarding 'Disclosures of related party transactions on consolidated basis for the half year ended as on September 30, 2019.'.

Updates

29-Aug-2019 | Source : NSE

MAS Financial Services Limited has informed the Exchange regarding 'Outcome of Finance Committee Meeting held today i.e. Thursday, August 29, 2019.'.

Updates

28-Aug-2019 | Source : NSE

MAS Financial Services Limited has informed the Exchange regarding 'Outcome of Finance Committee Meeting held today i.e. Wednesday, August 28, 2019'.

Corporate Actions stock-summary

stock-summary
BOARD MEETING

No Upcoming Board Meetings

stock-summary
DIVIDEND

MAS Financial Services Ltd has declared 7% dividend, ex-date: 25 Aug 26

stock-summary
SPLITS

No Splits history available

stock-summary
BONUS

MAS Financial Services Ltd has announced 2:1 bonus issue, ex-date: 22 Feb 24

stock-summary
RIGHTS

No Rights history available

stock-summaryKey Factors

Quality key factors stock-summary

Factor
Value
Sales Growth (5y)
27.75%
EBIT Growth (5y)
25.00%
Net Debt to Equity (avg)
3.47
Institutional Holding
23.37%
ROE (avg)
12.79%

Valuation key factors

Factor
Value
P/E Ratio
14
Industry P/E
21
Price to Book Value
1.84
EV to EBIT
10.11
EV to EBITDA
10.05
EV to Capital Employed
1.20
EV to Sales
7.06
PEG Ratio
0.61
Dividend Yield
0.63%
ROCE (Latest)
11.47%
ROE (Latest)
12.60%

Technicals key factors

Indicator
Weekly
Monthly
MACD
Bearish
Mildly Bearish
RSI
No Signal
No Signal
Bollinger Bands
Bearish
Mildly Bullish
Moving Averages
Bearish (Daily)
KST
Bearish
Bullish
Dow Theory
Mildly Bearish
Mildly Bullish
OBV
Mildly Bearish
Mildly Bullish
stock-summary Technical Indicator Scale: Bearish, Mildly Bearish, Sideways, Mildly Bullish, Bullish  Turned 
stock-summaryShareholding
Shareholding Snapshot : Jun 2026stock-summary
Shareholding Compare (%holding) stock-summary
Majority shareholders

Promoters

Pledged Promoter Holdings

None

Mutual Funds

Held by 7 Schemes (14.59%)

FIIs

Held by 90 FIIs (3.68%)

Promoter with highest holding

Shweta Kamlesh Gandhi (27.01%)

Highest Public shareholder

Nippon Life India Trustee Ltd-a/c Nippon India Small Cap Fund (8.23%)

Individual Investors Holdings

7.31%

stock-summaryFinancial
[
  {
    "link": "quarterly",
    "btn_text": "All Quarterly Results",
    "header": "Quarterly Results Snapshot (Consolidated) - Jun'26 - YoY",
    "rhs": [
      {
        "prefix": "Net Sales ",
        "suffix": "YoY Growth in quarter ended Jun 2026 is 20.70% vs 27.90% in Jun 2025",
        "dir": -1
      },
      {
        "prefix": "Consolidated Net Profit ",
        "suffix": "YoY Growth in quarter ended Jun 2026 is 26.78% vs 19.28% in Jun 2025",
        "dir": 1
      }
    ],
    "table": {
      "header": [
        "Jun'26",
        "Jun'25",
        "Change(%)"
      ],
      "body": [
        {
          "field": "Net Sales",
          "val1": "562.46",
          "val2": "465.98",
          "chgp": "20.70%",
          "chgp_class": "positive"
        },
        {
          "field": "Operating Profit (PBDIT) excl Other Income",
          "val1": "386.55",
          "val2": "333.91",
          "chgp": "15.76%",
          "chgp_class": "positive"
        },
        {
          "field": "Interest",
          "val1": "236.13",
          "val2": "217.10",
          "chgp": "8.77%",
          "chgp_class": "negative"
        },
        {
          "field": "Exceptional Items",
          "val1": "0.00",
          "val2": "0.00",
          "chgp": "",
          "chgp_class": "neutral"
        },
        {
          "field": "Consolidate Net Profit",
          "val1": "108.46",
          "val2": "85.55",
          "chgp": "26.78%",
          "chgp_class": "positive"
        },
        {
          "field": "Operating Profit Margin (Excl OI)",
          "val1": "68.72%",
          "val2": "71.66%",
          "chgp": "-2.94%",
          "chgp_class": "negative"
        }
      ]
    }
  },
  {
    "link": "half-yearly",
    "btn_text": "All Half Yearly Results",
    "header": "Half Yearly Results Snapshot (Consolidated) - Sep'25",
    "rhs": [
      {
        "prefix": "Net Sales ",
        "suffix": " Growth in half year ended Sep 2025 is 26.40% vs 24.28% in Sep 2024",
        "dir": 1
      },
      {
        "prefix": "Consolidated Net Profit ",
        "suffix": " Growth in half year ended Sep 2025 is 18.49% vs 25.70% in Sep 2024",
        "dir": -1
      }
    ],
    "table": {
      "header": [
        "Sep'25",
        "Sep'24",
        "Change(%)"
      ],
      "body": [
        {
          "field": "Net Sales",
          "val1": "946.21",
          "val2": "748.61",
          "chgp": "26.40%",
          "chgp_class": "positive"
        },
        {
          "field": "Operating Profit (PBDIT) excl Other Income",
          "val1": "680.28",
          "val2": "567.95",
          "chgp": "19.78%",
          "chgp_class": "positive"
        },
        {
          "field": "Interest",
          "val1": "440.91",
          "val2": "366.43",
          "chgp": "20.33%",
          "chgp_class": "negative"
        },
        {
          "field": "Exceptional Items",
          "val1": "0.00",
          "val2": "0.00",
          "chgp": "",
          "chgp_class": "neutral"
        },
        {
          "field": "Consolidate Net Profit",
          "val1": "175.89",
          "val2": "148.44",
          "chgp": "18.49%",
          "chgp_class": "positive"
        },
        {
          "field": "Operating Profit Margin (Excl OI)",
          "val1": "71.90%",
          "val2": "75.87%",
          "chgp": "-3.97%",
          "chgp_class": "negative"
        }
      ]
    }
  },
  {
    "link": "nine-monthly",
    "btn_text": "All Nine Monthly Results",
    "header": "Nine Monthly Results Snapshot (Consolidated) - Dec'25",
    "rhs": [
      {
        "prefix": "Net Sales ",
        "suffix": "YoY Growth in nine months ended Dec 2025 is 25.43% vs 23.59% in Dec 2024",
        "dir": 1
      },
      {
        "prefix": "Consolidated Net Profit ",
        "suffix": "YoY Growth in nine months ended Dec 2025 is 17.63% vs 25.44% in Dec 2024",
        "dir": -1
      }
    ],
    "table": {
      "header": [
        "Dec'25",
        "Dec'24",
        "Change(%)"
      ],
      "body": [
        {
          "field": "Net Sales",
          "val1": "1,452.96",
          "val2": "1,158.34",
          "chgp": "25.43%",
          "chgp_class": "positive"
        },
        {
          "field": "Operating Profit (PBDIT) excl Other Income",
          "val1": "1,044.01",
          "val2": "871.42",
          "chgp": "19.81%",
          "chgp_class": "positive"
        },
        {
          "field": "Interest",
          "val1": "672.00",
          "val2": "561.12",
          "chgp": "19.76%",
          "chgp_class": "negative"
        },
        {
          "field": "Exceptional Items",
          "val1": "-4.82",
          "val2": "0.00",
          "chgp": "",
          "chgp_class": "neutral"
        },
        {
          "field": "Consolidate Net Profit",
          "val1": "268.09",
          "val2": "227.91",
          "chgp": "17.63%",
          "chgp_class": "positive"
        },
        {
          "field": "Operating Profit Margin (Excl OI)",
          "val1": "71.85%",
          "val2": "75.23%",
          "chgp": "-3.38%",
          "chgp_class": "negative"
        }
      ]
    }
  },
  {
    "link": "annual",
    "btn_text": "All Annual Results",
    "header": "Annual Results Snapshot (Consolidated) - Mar'26",
    "rhs": [
      {
        "prefix": "Net Sales ",
        "suffix": "YoY Growth in year ended Mar 2026 is 24.91% vs 24.42% in Mar 2025",
        "dir": 1
      },
      {
        "prefix": "Consolidated Net Profit ",
        "suffix": "YoY Growth in year ended Mar 2026 is 19.60% vs 23.63% in Mar 2025",
        "dir": -1
      }
    ],
    "table": {
      "header": [
        "Mar'26",
        "Mar'25",
        "Change(%)"
      ],
      "body": [
        {
          "field": "Net Sales",
          "val1": "1,995.43",
          "val2": "1,597.45",
          "chgp": "24.91%",
          "chgp_class": "positive"
        },
        {
          "field": "Operating Profit (PBDIT) excl Other Income",
          "val1": "1,416.90",
          "val2": "1,186.71",
          "chgp": "19.40%",
          "chgp_class": "positive"
        },
        {
          "field": "Interest",
          "val1": "906.69",
          "val2": "762.80",
          "chgp": "18.86%",
          "chgp_class": "negative"
        },
        {
          "field": "Exceptional Items",
          "val1": "-4.82",
          "val2": "0.00",
          "chgp": "",
          "chgp_class": "neutral"
        },
        {
          "field": "Consolidate Net Profit",
          "val1": "371.21",
          "val2": "310.38",
          "chgp": "19.60%",
          "chgp_class": "positive"
        },
        {
          "field": "Operating Profit Margin (Excl OI)",
          "val1": "71.01%",
          "val2": "74.29%",
          "chgp": "-3.28%",
          "chgp_class": "negative"
        }
      ]
    }
  }
]

Quarterly Results Snapshot (Consolidated) - Jun'26 - YoYstock-summary

Jun'26
Jun'25
Change(%)
Net Sales
562.46
465.98
20.70%
Operating Profit (PBDIT) excl Other Income
386.55
333.91
15.76%
Interest
236.13
217.10
8.77%
Exceptional Items
0.00
0.00
Consolidate Net Profit
108.46
85.55
26.78%
Operating Profit Margin (Excl OI)
68.72%
71.66%
-2.94%
Values in Rs Cr.
Direction Arrows
Net Sales

YoY Growth in quarter ended Jun 2026 is 20.70% vs 27.90% in Jun 2025

Direction Arrows
Consolidated Net Profit

YoY Growth in quarter ended Jun 2026 is 26.78% vs 19.28% in Jun 2025

Half Yearly Results Snapshot (Consolidated) - Sep'25stock-summary

Sep'25
Sep'24
Change(%)
Net Sales
946.21
748.61
26.40%
Operating Profit (PBDIT) excl Other Income
680.28
567.95
19.78%
Interest
440.91
366.43
20.33%
Exceptional Items
0.00
0.00
Consolidate Net Profit
175.89
148.44
18.49%
Operating Profit Margin (Excl OI)
71.90%
75.87%
-3.97%
Values in Rs Cr.
Direction Arrows
Net Sales

Growth in half year ended Sep 2025 is 26.40% vs 24.28% in Sep 2024

Direction Arrows
Consolidated Net Profit

Growth in half year ended Sep 2025 is 18.49% vs 25.70% in Sep 2024

Nine Monthly Results Snapshot (Consolidated) - Dec'25stock-summary

Dec'25
Dec'24
Change(%)
Net Sales
1,452.96
1,158.34
25.43%
Operating Profit (PBDIT) excl Other Income
1,044.01
871.42
19.81%
Interest
672.00
561.12
19.76%
Exceptional Items
-4.82
0.00
Consolidate Net Profit
268.09
227.91
17.63%
Operating Profit Margin (Excl OI)
71.85%
75.23%
-3.38%
Values in Rs Cr.
Direction Arrows
Net Sales

YoY Growth in nine months ended Dec 2025 is 25.43% vs 23.59% in Dec 2024

Direction Arrows
Consolidated Net Profit

YoY Growth in nine months ended Dec 2025 is 17.63% vs 25.44% in Dec 2024

Annual Results Snapshot (Consolidated) - Mar'26stock-summary

Mar'26
Mar'25
Change(%)
Net Sales
1,995.43
1,597.45
24.91%
Operating Profit (PBDIT) excl Other Income
1,416.90
1,186.71
19.40%
Interest
906.69
762.80
18.86%
Exceptional Items
-4.82
0.00
Consolidate Net Profit
371.21
310.38
19.60%
Operating Profit Margin (Excl OI)
71.01%
74.29%
-3.28%
Values in Rs Cr.
Direction Arrows
Net Sales

YoY Growth in year ended Mar 2026 is 24.91% vs 24.42% in Mar 2025

Direction Arrows
Consolidated Net Profit

YoY Growth in year ended Mar 2026 is 19.60% vs 23.63% in Mar 2025

stock-summaryCompany CV
About MAS Financial Services Ltd stock-summary
stock-summary
MAS Financial Services Ltd
Small Cap
Non Banking Financial Company (NBFC)
MAS Financial Services Limited is a Gujarat-headquartered NBFC with more than two decades of business operations. The Company operates out of Ahmedabad and specialises in providing retail financing services to the lower and middle-income groups of society. The Company offers financial services for Micro Enterprises Loans, SME Loans, Home Loans, Two Wheeler Loans, Used Car Loans, Salaried Personal Loan, Housing Loans and Commercial Vehicle Loans to satisfy their varied needs.
Company Coordinates stock-summary
Company Details
6 Narayan Chambers Ground Flr, Behind PatangHotel Ashram Road Ahmedabad Gujarat : 380009
stock-summary
Tel: 91-79-30016500
stock-summary
secretarial@mas.co.in
Registrar Details
Link Intime India Pvt Ltd, C-13 Pannalal Silk Compound, L B S Marg, Bhandup , Mumbai