
Compare DCW with Similar Stocks
Dashboard
Weak Long Term Fundamental Strength with a -0.71% CAGR growth in Operating Profits over the last 5 years
- Company's ability to service its debt is weak with a poor EBIT to Interest (avg) ratio of 1.83
- The company has been able to generate a Return on Equity (avg) of 7.27% signifying low profitability per unit of shareholders funds
With ROE of 4.5, it has a Expensive valuation with a 1.4 Price to Book Value
Falling Participation by Institutional Investors
Underperformed the market in the last 1 year
Stock DNA
Petrochemicals
INR 1,519 Cr (Small Cap)
31.00
43
0.39%
0.08
4.48%
1.40
Total Returns (Price + Dividend) 
Latest dividend: 0.1 per share ex-dividend date: Feb-20-2026
Risk Adjusted Returns v/s
Returns Beta

News
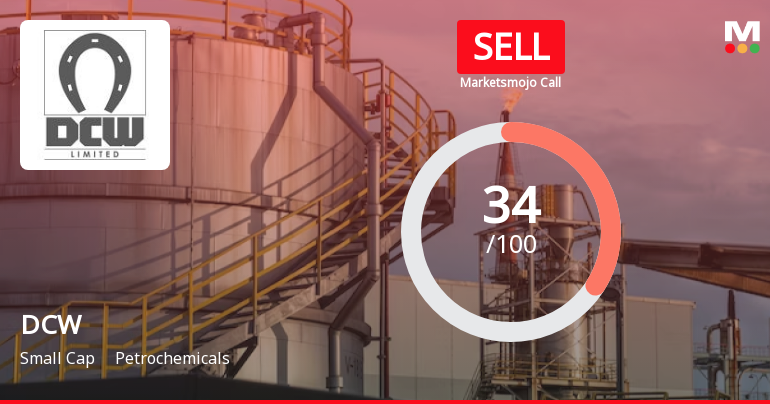
DCW Ltd Downgraded to Sell Amid Mixed Financial and Valuation Signals
DCW Ltd, a small-cap player in the petrochemicals sector, has seen its investment rating downgraded from Hold to Sell by MarketsMOJO as of 6 May 2026. This shift reflects a complex interplay of improved financial trends, deteriorating quality metrics, expensive valuation, and mixed technical signals, prompting a reassessment of the stock’s attractiveness for investors.
Read full news article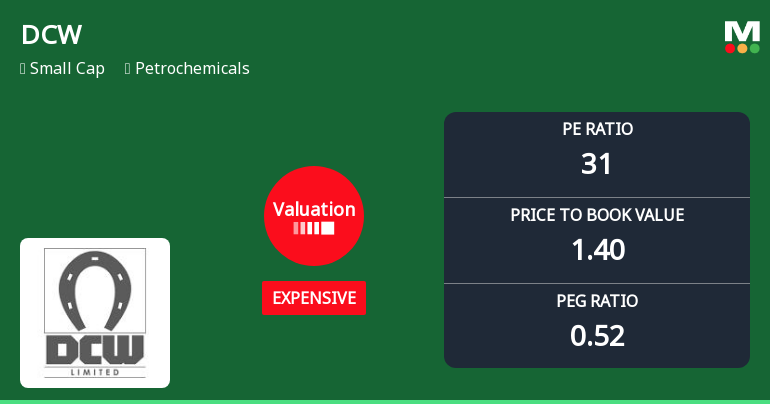
DCW Ltd Valuation Shifts Signal Growing Price Pressure Amid Sector Comparisons
DCW Ltd, a small-cap player in the petrochemicals sector, has seen a notable shift in its valuation parameters, moving from an attractive to an expensive rating. This change reflects evolving market perceptions amid sector-wide valuation trends and company-specific financial metrics, prompting a downgrade in its Mojo Grade from Hold to Sell as of 6 May 2026.
Read full news article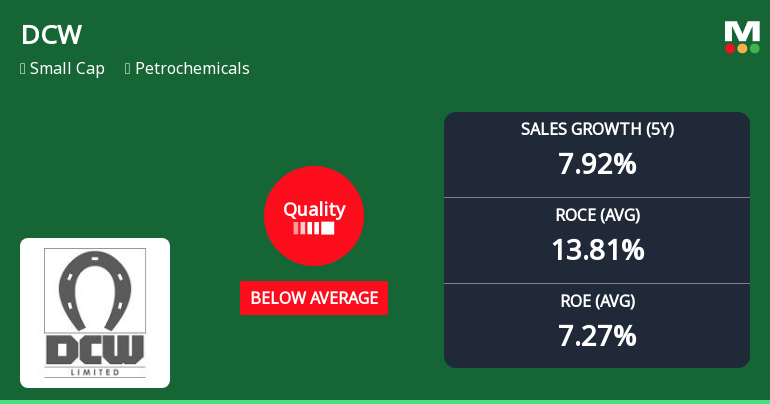
DCW Ltd Downgraded to Sell as Quality Parameters Deteriorate Amid Mixed Financial Performance
DCW Ltd, a small-cap player in the petrochemicals sector, has seen its quality rating downgraded from average to below average, prompting a shift in its MarketsMOJO grade from Hold to Sell as of 6 May 2026. This change reflects a notable deterioration in key business fundamentals including return ratios, growth consistency, and leverage metrics, raising concerns about the company’s operational efficiency and financial health amid a challenging industry backdrop.
Read full news article Announcements
DCW Limited - Outcome of Board Meeting
15-Nov-2019 | Source : NSEDCW Limited has informed the Exchange regarding Board meeting held on November 14, 2019.
DCW Limited - Updates
13-Nov-2019 | Source : NSEDCW Limited has informed the Exchange regarding Newspaper Publication pursuant to the provisions of Regulation 29 read with Regulation 47 of SEBI (Listing Obligations and Disclosure Requirements) Regulations, 2015 regarding Board Meeting to be held on November 14, 2019.
DCW Limited - Updates
22-Oct-2019 | Source : NSEDCW Limited has informed the Exchange regarding 'DISCLOSURE UNDER REGULATION 29(1) & (2) OF SEBI (SUBSTANTIAL ACQUISITION OF SHARES AND TAKEOVERS) REGULATIONS, 2011'.
Corporate Actions

No Upcoming Board Meetings

DCW Ltd has declared 5% dividend, ex-date: 20 Feb 26

No Splits history available

No Bonus history available

No Rights history available
Quality key factors
Valuation key factors
Technicals key factors
 Technical Indicator Scale: Bearish, Mildly Bearish, Sideways, Mildly Bullish, Bullish Turned
 Shareholding Snapshot : Feb 2026
Shareholding Compare (%holding)
Non Institution
3.8476
Held by 6 Schemes (0.0%)
Held by 45 FIIs (8.17%)
Ashish Jain (10.97%)
Eriska Investment Fund Ltd (2.77%)
31.08%
Quarterly Results Snapshot (Standalone) - Mar'26 - QoQ

QoQ Growth in quarter ended Mar 2026 is 17.17% vs -3.60% in Dec 2025
QoQ Growth in quarter ended Mar 2026 is 268.98% vs -64.52% in Dec 2025
Half Yearly Results Snapshot (Standalone) - Sep'25

Growth in half year ended Sep 2025 is 2.68% vs 15.98% in Sep 2024
Growth in half year ended Sep 2025 is 359.85% vs -56.68% in Sep 2024
Nine Monthly Results Snapshot (Standalone) - Dec'25
YoY Growth in nine months ended Dec 2025 is 4.93% vs 17.00% in Dec 2024
YoY Growth in nine months ended Dec 2025 is 59.26% vs 5,627.27% in Dec 2024
Annual Results Snapshot (Standalone) - Mar'26
YoY Growth in year ended Mar 2026 is 7.16% vs 6.88% in Mar 2025
YoY Growth in year ended Mar 2026 is 60.19% vs 92.02% in Mar 2025
About DCW Ltd

Company Coordinates


