
Compare Manali Petrochem with Similar Stocks
Dashboard
The company is Net-Debt Free
Poor long term growth as Operating profit has grown by an annual rate -29.40% of over the last 5 years
The company has declared Positive results for the last 4 consecutive quarters
With ROE of 5.3, it has a Attractive valuation with a 0.9 Price to Book Value
Despite the size of the company, domestic mutual funds hold only 0.02% of the company
Underperformed the market in the last 1 year
Stock DNA
Petrochemicals
INR 1,061 Cr (Micro Cap)
16.00
14
0.81%
-0.37
5.33%
0.83
Total Returns (Price + Dividend) 
Latest dividend: 0.5 per share ex-dividend date: Sep-08-2025
Risk Adjusted Returns v/s
Returns Beta

News

Manali Petrochemicals Ltd Downgraded to Hold Amid Mixed Financial and Technical Signals
Manali Petrochemicals Ltd, a micro-cap player in the petrochemicals sector, has seen its investment rating downgraded from Buy to Hold as of 17 July 2026. This adjustment reflects a nuanced assessment across four key parameters: quality, valuation, financial trend, and technical indicators. While the company demonstrates strong recent profitability and a net-debt-free balance sheet, mixed technical signals and subdued long-term growth prospects have tempered investor enthusiasm.
Read full news article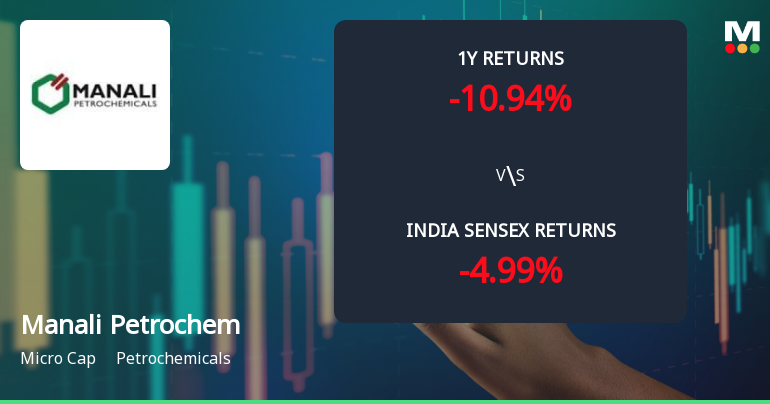
Manali Petrochemicals Ltd Technical Momentum Shifts Amid Mixed Market Signals
Manali Petrochemicals Ltd has experienced a notable shift in its technical momentum, moving from a bullish to a mildly bullish stance as of July 2026. Despite a recent downgrade in its Mojo Grade from Buy to Hold, the micro-cap petrochemicals company continues to display mixed signals across key technical indicators, reflecting a complex market environment and investor sentiment.
Read full news article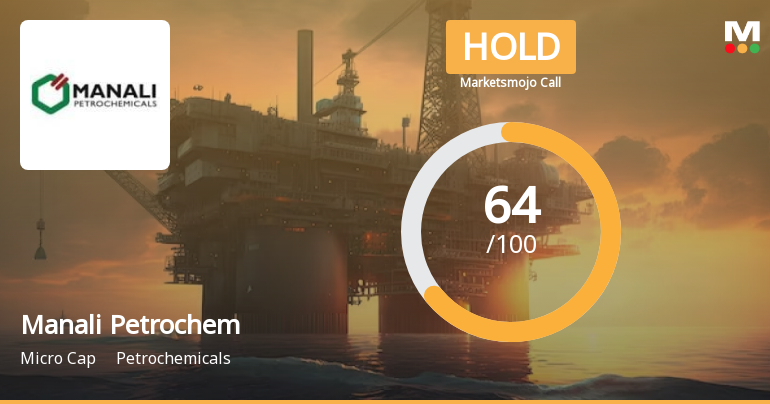
Manali Petrochemicals Ltd is Rated Hold
Manali Petrochemicals Ltd is rated 'Hold' by MarketsMOJO, with this rating last updated on 17 July 2026. While the rating change occurred on that date, the analysis and financial metrics discussed here reflect the company’s current position as of 19 July 2026, providing investors with the most recent and relevant data to assess the stock’s outlook.
Read full news article Announcements
Manali Petrochemicals Limited - Other General Purpose
03-Dec-2019 | Source : NSEManali Petrochemicals Limited has submitted to the Exchange a copy of details of Related Party Transactions pursuant toáRegulation 23(9) of the SEBI (Listing Obligations and Disclosure Requirements) Regulations, 2015 for the half year ended September 30, 2019.á
Manali Petrochemicals Limited - Press Release
13-Nov-2019 | Source : NSEManali Petrochemicals Limited has informed the Exchange regarding a press release dated November 12, 2019, titled "Q2 RESULTS".
Manali Petrochemicals Limited - Trading Window
25-Sep-2019 | Source : NSEManali Petrochemicals Limited has informed the Exchange regarding the Trading Window closure pursuant to SEBI (Prohibition of Insider Trading) Regulations, 2015
Corporate Actions

No Upcoming Board Meetings

Manali Petrochemicals Ltd has declared 10% dividend, ex-date: 08 Sep 25

Manali Petrochemicals Ltd has announced 5:8 stock split, ex-date: 28 Sep 06

No Bonus history available

No Rights history available
Quality key factors
Valuation key factors
Technicals key factors
 Technical Indicator Scale: Bearish, Mildly Bearish, Sideways, Mildly Bullish, Bullish Turned
 Shareholding Snapshot : Mar 2026
Shareholding Compare (%holding)
Non Institution
None
Held by 4 Schemes (0.01%)
Held by 22 FIIs (0.37%)
Sidd Life Sciences Private Limited (38.28%)
Mercantile Ventures Limited (2.39%)
39.19%
Quarterly Results Snapshot (Consolidated) - Mar'26 - QoQ

QoQ Growth in quarter ended Mar 2026 is 18.48% vs -0.41% in Dec 2025

QoQ Growth in quarter ended Mar 2026 is -57.56% vs 277.02% in Dec 2025
Half Yearly Results Snapshot (Consolidated) - Sep'25
Growth in half year ended Sep 2025 is 2.56% vs -17.62% in Sep 2024
Growth in half year ended Sep 2025 is 145.76% vs -11.69% in Sep 2024
Nine Monthly Results Snapshot (Consolidated) - Dec'25
YoY Growth in nine months ended Dec 2025 is 9.44% vs -14.09% in Dec 2024
YoY Growth in nine months ended Dec 2025 is 445.81% vs 3.24% in Dec 2024
Annual Results Snapshot (Consolidated) - Mar'26
YoY Growth in year ended Mar 2026 is 13.96% vs -13.10% in Mar 2025
YoY Growth in year ended Mar 2026 is 343.36% vs 52.58% in Mar 2025
About Manali Petrochemicals Ltd

Company Coordinates


