
 Price Point
Compare Page Industries with Similar Stocks
ScoreDashboard
Strong Long Term Fundamental Strength with an average Return on Equity (ROE) of 46.19%
- Company has a Debt to Equity ratio (avg) of 0.06 times
Flat results in Jun 26
With ROE of 52, it has a Very Expensive valuation with a 27.6 Price to Book Value
High Institutional Holdings at 52.55%
Below par performance in long term as well as near term
With its market cap of Rs 41,492 cr, it is the biggest company in the sector and constitutes 24.57% of the entire sector
Mojo ParametersStock DNA

Garments & Apparels

INR 41,676 Cr (Mid Cap)

53.00
45

1.61%

-0.10

52.03%

27.61
Total ReturnsTotal Returns (Price + Dividend) 
Latest dividend: 200 per share ex-dividend date: Aug-19-2026
Risk Adjusted Returns v/s
Returns Beta
 News & Corporate Actions
News
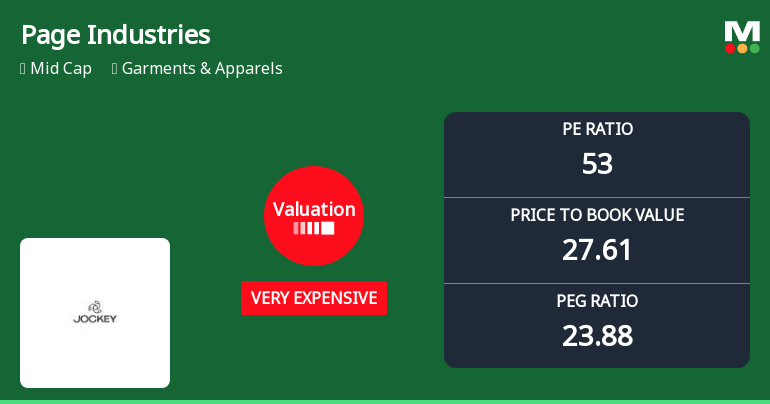
Page Industries Ltd Valuation Shifts to Very Expensive Amidst Mixed Market Returns
Page Industries Ltd, a prominent player in the Garments & Apparels sector, has witnessed a notable shift in its valuation parameters, moving from an expensive to a very expensive rating. This change, coupled with its current price multiples and returns relative to the Sensex, raises important questions about the stock's price attractiveness and investment appeal going forward.
Read full news article
Page Industries Ltd Sees Sharp Open Interest Surge Amidst Mixed Market Signals
Page Industries Ltd (PAGEIND), a key player in the Garments & Apparels sector, witnessed a notable surge in open interest (OI) in its derivatives segment on 22 Sep 2026, signalling heightened market activity and shifting investor positioning. Despite a mixed technical backdrop and falling delivery volumes, the stock outperformed its sector peers, prompting a closer examination of the underlying market dynamics and potential directional bets.
Read full news article
Page Industries Ltd Sees Sharp Open Interest Surge Amidst Mixed Market Signals
Page Industries Ltd (PAGEIND), a mid-cap player in the Garments & Apparels sector, witnessed a significant 19.0% surge in open interest (OI) in its derivatives segment on 22 Sep 2026, signalling heightened market activity and evolving positioning among traders. This increase accompanies a 3.15% gain in the stock price, outperforming its sector and broader indices, yet underlying volume and delivery trends suggest a nuanced market outlook.
Read full news article Announcements
Page Industries Limited - Dividend
15-Nov-2019 | Source : NSEPage Industries Limited has informed the Exchange that Board of Directors at its meeting held on November 14, 2019, declared Interim Dividend of Rs. 52 per equity share.
Page Industries Limited - Record Date
23-Oct-2019 | Source : NSEPage Industries Limited has informed the Exchange that the Company has fixed Record Date as November 22, 2019 for the purpose of 2nd Interim Dividend 2019-20.
Shareholders meeting
08-Aug-2019 | Source : NSE
| Page Industries Limited has informed the Exchange regarding Proceedings of Annual General Meeting held on August 08, 2019. Further, the company has submitted the Exchange a copy of Srutinizers report along with voting results. |
Corporate Actions

No Upcoming Board Meetings

Page Industries Ltd has declared 2000% dividend, ex-date: 19 Aug 26

No Splits history available

No Bonus history available

No Rights history available
Key FactorsQuality key factors
Valuation key factors
Technicals key factors
 Technical Indicator Scale: Bearish, Mildly Bearish, Sideways, Mildly Bullish, Bullish Turned Shareholding
Shareholding Snapshot : Jun 2026
Shareholding Compare (%holding)
Promoters
None
Held by 30 Schemes (23.7%)
Held by 550 FIIs (18.91%)
Ramesh Genomal (14.29%)
Sbi Equity Hybrid Fund (9%)
3.65%
FinancialQuarterly Results Snapshot (Standalone) - Jun'26 - QoQ
 Compare with Peers
QoQ Growth in quarter ended Jun 2026 is 13.40% vs -9.67% in Mar 2026
QoQ Growth in quarter ended Jun 2026 is 7.88% vs -5.70% in Mar 2026

Half Yearly Results Snapshot (Standalone) - Sep'25

Growth in half year ended Sep 2025 is 3.31% vs 7.05% in Sep 2024
Growth in half year ended Sep 2025 is 9.73% vs 16.80% in Sep 2024
Nine Monthly Results Snapshot (Standalone) - Dec'25
YoY Growth in nine months ended Dec 2025 is 4.10% vs 7.08% in Dec 2024
YoY Growth in nine months ended Dec 2025 is 3.53% vs 22.59% in Dec 2024
Annual Results Snapshot (Standalone) - Mar'26
YoY Growth in year ended Mar 2026 is 6.32% vs 8.00% in Mar 2025
YoY Growth in year ended Mar 2026 is 4.76% vs 28.10% in Mar 2025
 Company CV
About Page Industries Ltd

Company Coordinates










