Page Industries

  • Market Cap: Mid Cap
  • Industry: Garments & Apparels
  • ISIN: INE761H01022
  • NSEID: PAGEIND
  • BSEID: 532827
INR
35,560.00
-80 (-0.22%)
BSENSE

Feb 06

BSE+NSE Vol: 36.02 k

  • Price Points
  • Score
  • Mojo Parameters
  • Total Return
  • News and Corporate Actions
  • Key factors
  • Shareholding
  • Financials
  • CompanyCV
stock-summaryPrice Point
High/Low

1Day

52 Week

Valuation
Technical
Day's Volume

CASH

36.02 k (-2.04%) Volume

Shareholding (Dec 2025)

FII

20.72%

Held by 573 FIIs

DII

4.60%

Held by 40 DIIs

Promoter

42.89%

how big is Page Industries?

06-Jun-2025

As of Jun 06, Page Industries Ltd has a market capitalization of 51,469.44 Cr, with recent net sales of 4934.91 Cr and a net profit of 729.15 Cr for the latest four quarters.

Market Cap: Page Industries Ltd has a market capitalization of 51,469.44 Cr and is classified as a Large Cap company as of Jun 06.<BR><BR>Recent Quarterly Performance: The company reported net sales of 4934.91 Cr and a net profit of 729.15 Cr for the latest 4 quarters, which is based on Standalone data.<BR><BR>Balance Sheet Snapshot: This is Standalone data for the latest annual period ending in Mar'24. The shareholder's funds are valued at 1,596.93 Cr, and the total assets amount to 2,673.31 Cr.

View full answer

When is the next results date for Page Industries?

06-Jun-2025

No Upcoming Board Meetings

Who are the peers of the Page Industries?

03-Jun-2025

Page Industries' peers include Trent, K P R Mill Ltd, Vedant Fashions, Trident, Vardhman Textile, Welspun Living, Aditya Birla Fashion, Alok Industries, and Arvind Ltd. K P R Mill Ltd shows excellent management and growth, while Page Industries has an excellent capital structure and a 1-year return of 26.58%.

Peers: The peers of Page Industries are Trent, K P R Mill Ltd, Vedant Fashions, Trident, Vardhman Textile, Welspun Living, Aditya Bir. Fas., Alok Industries, Arvind Ltd.<BR><BR>Quality Snapshot: Excellent management risk is observed at K P R Mill Ltd, Vedant Fashions, and Page Industries, while Good management risk is found at Trent, Vardhman Textile, and Welspun Living, and Average management risk is seen at Trident, Aditya Bir. Fas., and Arvind Ltd. Growth is Excellent at K P R Mill Ltd, Good at Trent, and Below Average at Page Industries, Vedant Fashions, Trident, Vardhman Textile, Welspun Living, Aditya Bir. Fas., Alok Industries, and Arvind Ltd. Capital Structure is Excellent at Page Industries, K P R Mill Ltd, and Vedant Fashions, Good at Trent, Vardhman Textile, and Trident, Average at Welspun Living and Arvind Ltd, and Below Average at Aditya Bir. Fas. and Alok Industries.<BR><BR>Return Snapshot: K P R Mill Ltd has the highest 1-year return at 41.09%, while Aditya Bir. Fas. has the lowest at -70.35%. Page Industries' 1-year return of 26.58% is significantly higher than Aditya Bir. Fas. but lower than K P R Mill Ltd. Additionally, the peers with negative six-month returns include Vedant Fashions, Trident, Welspun Living, Aditya Bir. Fas., and Alok Industries.

View full answer

Is Page Industries overvalued or undervalued?

09-Jun-2025

As of September 4, 2020, Page Industries is considered very expensive with a PE ratio of 70.70, significantly higher than its peers, indicating that the stock is overvalued despite a strong return of 20.21% over the past year.

As of 4 September 2020, the valuation grade for Page Industries moved from expensive to very expensive, indicating a significant shift in its perceived value. The company is currently overvalued, with a PE ratio of 70.70, a Price to Book Value of 36.64, and an EV to EBITDA ratio of 48.32. These ratios suggest that the stock is trading at a premium compared to its earnings and book value.<BR><BR>In comparison to its peers, Page Industries stands out with a notably high PE ratio of 70.70, while its closest competitor, with a PE of around 50, highlights the disparity in valuation. Additionally, the PEG ratio of 2.52 further emphasizes the overvaluation, as it suggests that the stock price is not justified by its growth rate. Despite a strong return of 20.21% over the past year compared to the Sensex's 7.60%, the current valuation metrics indicate that investors may be paying too much for Page Industries at this time.

View full answer

Who are in the management team of Page Industries?

16-Jul-2025

As of March 2023, the management team of Page Industries includes Sunder Genomal (Chairman), V S Ganesh (Managing Director), and several non-executive and independent directors, such as Ramesh Genomal and G P Albal, among others, contributing to the company's governance and strategy.

As of March 2023, the management team of Page Industries includes the following individuals:<BR><BR>1. Sunder Genomal - Chairman (Non-Executive)<BR>2. Ramesh Genomal - Non-Executive Director<BR>3. G P Albal - Non-Executive & Independent Director<BR>4. C Murugesh - Company Secretary & Compliance Officer<BR>5. Shamir Genomal - Deputy Managing Director<BR>6. Rukmani Menon - Non-Executive & Independent Director<BR>7. Sandeep Kumar Maini - Non-Executive & Independent Director<BR>8. Vikram Gamanlal Shah - Non-Executive & Independent Director<BR>9. V S Ganesh - Managing Director<BR>10. Varun Berry - Non-Executive & Independent Director<BR>11. Mark Fedyk - Non-Executive Director<BR>12. Sanjeev Genomal - Director<BR>13. ARIF VAZIRALLY - Non-Executive & Independent Director<BR>14. Rohan Genomal - Non-Executive Director<BR>15. Shahendar Genomal - Alternate Director<BR>16. Jignesh Bhate - Independent Director<BR><BR>This diverse team includes a mix of executive, non-executive, and independent directors, contributing to the governance and strategic direction of the company.

View full answer

What does Page Industries do?

17-Jul-2025

Page Industries Ltd manufactures and markets JOCKEY and Speedo brands, primarily in India and the UAE. As of March 2025, it reported net sales of ₹10,981 Cr and a net profit of ₹1,640 Cr, with a market cap of ₹54,860 Cr.

Overview:<BR>Page Industries Ltd is a large-cap company in the Garments & Apparels industry, primarily engaged in the manufacture, distribution, and marketing of the JOCKEY and Speedo brands in various countries.<BR><BR>History:<BR>Incorporated in 1995 and headquartered in Bangalore, Page Industries is the exclusive licensee for the JOCKEY brand in several countries, including India and the UAE, as well as for the Speedo brand in India. The latest quarterly results reported net sales and net profit for March 2025.<BR><BR>Financial Snapshot:<BR>Most recent Net Sales: 10,981 Cr (Quarterly Results - Mar 2025) <BR>Most recent Net Profit: 1,640 Cr (Quarterly Results - Mar 2025) <BR>Market-cap value: INR 54,860 Cr (Large Cap)<BR><BR>Key Metrics:<BR>P/E: 72.00 <BR>Industry P/E: 83 <BR>Dividend Yield: 1.84% <BR>Debt-Equity: -0.15 <BR>Return on Equity: 51.82% <BR>Price to Book: 38.85 <BR><BR>Contact Details:<BR>Address: Cessna Business Park Tower-1, 7th Floor Umiya Business Bay Bengaluru Karnataka : 560103 <BR>Tel: 91-80-49454545 <BR>Email: info@jockeyindia.com <BR>Website: http://www.pageind.com

View full answer

Who are the top shareholders of the Page Industries?

17-Jul-2025

The top shareholders of Page Industries include promoters led by Ramesh Genomal with 14.29%, institutional investors holding 20.3% through mutual funds, and Foreign Institutional Investors (FIIs) with 23.58%. The SBI Blue Chip Fund is the largest public shareholder at 9.5%, while individual investors own 3.88%.

The top shareholders of Page Industries include a mix of promoters, institutional investors, and individual shareholders. The majority shareholders are the promoters, with Ramesh Genomal holding the highest individual stake at 14.29%. <BR><BR>In terms of institutional investments, mutual funds hold a significant portion through 34 schemes, accounting for 20.3% of the shares. Foreign Institutional Investors (FIIs) also have a notable presence, holding 23.58% of the company. The highest public shareholder is the SBI Blue Chip Fund, which holds 9.5%. Additionally, individual investors collectively hold 3.88% of the shares.

View full answer

Is Page Industries technically bullish or bearish?

26-Sep-2025

As of September 25, 2025, Page Industries shows a bearish trend with moderate strength, indicated by bearish MACD and moving averages on the weekly and daily timeframes, despite mixed signals from KST and mildly bearish trends from Dow Theory and OBV.

As of 25 September 2025, the technical trend has changed from mildly bearish to bearish. The current stance is bearish with moderate strength. Key indicators driving this include a bearish MACD on the weekly timeframe, bearish moving averages on the daily timeframe, and bearish signals from Bollinger Bands on the weekly timeframe. The KST is bearish on the weekly but bullish on the monthly, indicating mixed signals over different timeframes. Additionally, both the Dow Theory and OBV show mildly bearish trends on the weekly and monthly. Overall, the combination of these indicators suggests a bearish outlook for Page Industries.

View full answer

How has been the historical performance of Page Industries?

13-Nov-2025

Page Industries has exhibited consistent growth in net sales and profitability, with net sales increasing from 2,832.96 Cr in Mar'21 to 4,934.91 Cr in Mar'25, and profit after tax rising from 340.58 Cr to 729.14 Cr in the same period. The company also improved its cash flow from operating activities significantly, reaching 1,203.00 Cr in Mar'25.

Answer:<BR>The historical performance of Page Industries shows a consistent growth trend in net sales and profitability over the years.<BR><BR>Breakdown:<BR>Page Industries has demonstrated a steady increase in net sales, rising from 2,832.96 Cr in Mar'21 to 4,934.91 Cr in Mar'25. The total operating income followed a similar trajectory, reaching 4,934.91 Cr in Mar'25, up from 2,832.96 Cr in Mar'21. Operating profit (PBDIT) also saw an upward trend, climbing to 1,124.18 Cr in Mar'25 from 546.07 Cr in Mar'21. Profit before tax increased significantly to 978.58 Cr in Mar'25, compared to 453.42 Cr in Mar'21, while profit after tax reached 729.14 Cr in Mar'25, up from 340.58 Cr in Mar'21. The earnings per share (EPS) rose to 653.94 in Mar'25 from 305.45 in Mar'21, reflecting strong profitability growth. On the balance sheet, total assets increased from 1,512.94 Cr in Mar'20 to 2,634.61 Cr in Mar'25, while total liabilities rose from 1,512.94 Cr to 2,634.61 Cr in the same period. Cash flow from operating activities improved significantly, reaching 1,203.00 Cr in Mar'25, compared to a negative cash flow of -1.00 Cr in Mar'23. Overall, Page Industries has shown robust growth in sales, profits, and cash flow, indicating a strong financial performance over the years.

View full answer

Are Page Industries Ltd latest results good or bad?

06-Feb-2026

Page Industries Ltd's latest results show strong revenue growth of 7.43% to ₹1,386.76 crores, but net profit declined by 7.38%, raising concerns about margin pressures and profitability. While operating margins improved slightly, the persistent decline in profits suggests challenges ahead for the company.

Page Industries Ltd's latest results present a mixed picture. On one hand, the company achieved a strong revenue growth of 7.43% quarter-on-quarter, reaching ₹1,386.76 crores, which reflects its ability to maintain market share in a competitive environment. However, this revenue growth did not translate into net profit gains, as net profit declined by 7.38% both quarter-on-quarter and year-on-year, totaling ₹189.54 crores. This marks the second consecutive quarter of profit decline, raising concerns about the company's ability to protect its margins amid rising costs.<BR><BR>Operating margins showed some improvement, increasing sequentially by 129 basis points to 22.94%, but this was accompanied by a year-on-year decline of 10 basis points. More concerning is the compression of the profit after tax (PAT) margin, which fell to 13.67%, indicating that cost pressures are intensifying.<BR><BR>Overall, while Page Industries continues to demonstrate strong operational efficiency and maintains an impressive return on equity of 54.24%, the persistent margin pressures and declining profits suggest challenges ahead. Investors may need to monitor the company's ability to manage costs and sustain profitability in the coming quarters.

View full answer

Should I buy, sell or hold Page Industries Ltd?

06-Feb-2026

Has Page Industries Ltd declared dividend?

06-Feb-2026

Yes, Page Industries Ltd has declared a dividend of 1250% (₹125 per share) with an ex-date of February 11, 2026. While the dividend yield is 1.75%, total returns have been mixed, showing negative performance in most periods except for the last five years, which saw a total return of 28.36%.

Page Industries Ltd has declared a dividend.<BR><BR>Dividend Details:<BR>- Percentage announced: 1250%<BR>- Amount per share: 125 per share<BR>- Ex-date: 11 Feb 26<BR><BR>Dividend Yield: 1.75%.<BR><BR>Total Returns by Period:<BR>In the 3 Months period, the price return was -10.75%, the dividend return was 0.62%, resulting in a total return of -10.13%.<BR><BR>In the 6 Months period, the price return was -23.26%, the dividend return was 0.89%, leading to a total return of -22.37%.<BR><BR>In the 1 Year period, the price return was -19.21%, the dividend return was 1.79%, culminating in a total return of -17.42%.<BR><BR>In the 2 Years period, the price return was -2.36%, the dividend return was 3.87%, resulting in a total return of 1.51%.<BR><BR>In the 3 Years period, the price return was -10.22%, the dividend return was 4.35%, leading to a total return of -5.87%.<BR><BR>In the 4 Years period, the price return was -14.81%, the dividend return was 4.53%, culminating in a total return of -10.28%.<BR><BR>In the 5 Years period, the price return was 20.78%, the dividend return was 7.58%, resulting in a total return of 28.36%.<BR><BR>Overall, while Page Industries Ltd has declared a significant dividend, the total returns over various periods show a mixed performance, with negative returns in most periods except for the 5 Years period, which indicates a potential recovery in the long term.

View full answer

Why is Page Industries Ltd falling/rising?

06-Feb-2026

As of 06-Feb, Page Industries Ltd's stock price is at 35,500.00, reflecting a decline of 0.45% after a trend reversal. Despite strong long-term fundamentals, the stock has underperformed significantly over the past year and shows bearish trends in moving averages.

As of 06-Feb, Page Industries Ltd's stock price is falling, currently at 35,500.00, which reflects a decrease of 161.8 points or 0.45%. This decline follows a trend reversal after four consecutive days of gains. The stock has underperformed its sector by 0.33% today and reached an intraday low of Rs 34,203.8, marking a significant drop of 4.09%. <BR><BR>Despite some positive indicators, such as a strong long-term fundamental strength with an average Return on Equity (ROE) of 45.83% and healthy operating profit growth, the stock's performance over the past year has been notably poor, with a decline of 19.21% compared to a 7.07% increase in the Sensex. Additionally, over the last three years, Page Industries Ltd has seen a decrease of 10.22%, while the benchmark has risen by 38.13%. <BR><BR>The stock's moving averages indicate that it is currently higher than the 5-day and 20-day averages but lower than the 50-day, 100-day, and 200-day averages, suggesting a bearish trend. Although there has been a rise in investor participation, with delivery volume increasing by 46.04% against the 5-day average, the overall market sentiment appears to be negative, contributing to the stock's current decline.

View full answer
iScoreScore
Click here to find our call on this stock
Strong Sell
Sell
Hold
Buy
Strong Buy

MarketsMojo — Loved in India, Now Global

The power of Mojo is now in 29 countries. Explore global equities with the same cutting-edge features you love.

Dashboard

1

Strong Long Term Fundamental Strength with an average Return on Equity (ROE) of 45.83%

  • Healthy long term growth as Operating profit has grown by an annual rate 30.74%
  • Company has a low Debt to Equity ratio (avg) at 0.02 times
2

Positive results in Dec 25

3

With ROE of 55, it has a Very Expensive valuation with a 28.1 Price to Book Value

4

High Institutional Holdings at 52.21%
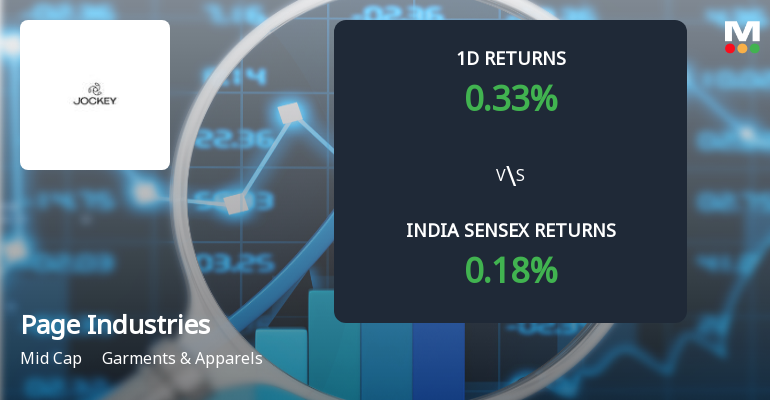
5

Below par performance in long term as well as near term

stock-summaryMojo Parameters

Mojo Parameters

Loading Valuation Snapshot...

Stock DNA

stock-summary
Industry

Garments & Apparels

stock-summary
Market cap

INR 38,737 Cr (Mid Cap)

stock-summary
P/E

51.00

stock-summary
Industry P/E

50

stock-summary
Dividend Yield

1.75%

stock-summary
Debt Equity

-0.17

stock-summary
Return on Equity

54.24%

stock-summary
Price to Book

28.23

Revenue and Profits:
Net Sales:
1,387 Cr
(Quarterly Results - Dec 2025)
Net Profit:
190 Cr
stock-summaryTotal Returns
Total Returns (Price + Dividend) stock-summary
Dividend Yield (1.75%)
TimePeriod
Price Return
Dividend Return
Total Return
3 Months
-10.56%
0.62%
-9.94%
6 Months
-23.2%
0.89%
-22.31%
1 Year
-19.17%
1.76%
-17.41%
2 Years
-2.19%
3.87%
1.68%
3 Years
-10.04%
4.35%
-5.69%
4 Years
-14.71%
4.53%
-10.18%
5 Years
20.95%
7.86%
28.81%

Latest dividend: 125 per share ex-dividend date: Nov-19-2025

Risk Adjusted Returns v/s stock-summary
Returns Beta
Icon
Beta has not been calculated since enough price history is not available
stock-summaryNews & Corporate Actions

News

Page Industries Gains 7.69%: 3 Key Factors Driving the Weekly Rally

Key Events This Week

2 Feb: Stock opens at Rs.32,834.20, down 0.45% amid broader market weakness

3 Feb: Sharp rebound with 3.11% gain following positive market sentiment

5 Feb: Q3 FY26 results reveal margin pressures despite revenue growth

6 Feb: Financial trend upgraded to positive; stock gains 3.60%

Announcements stock-summary

Page Industries Limited - Dividend

15-Nov-2019 | Source : NSE

Page Industries Limited has informed the Exchange that Board of Directors at its meeting held on November 14, 2019, declared Interim Dividend of Rs. 52 per equity share.

Page Industries Limited - Record Date

23-Oct-2019 | Source : NSE

Page Industries Limited has informed the Exchange that the Company has fixed Record Date as November 22, 2019 for the purpose of 2nd Interim Dividend 2019-20.

Shareholders meeting

08-Aug-2019 | Source : NSE

Page Industries Limited has informed the Exchange regarding Proceedings of Annual General Meeting held on August 08, 2019. Further, the company has submitted the Exchange a copy of Srutinizers report along with voting results.

Corporate Actions stock-summary

stock-summary
BOARD MEETING

No Upcoming Board Meetings

stock-summary
DIVIDEND

Page Industries Ltd has declared 1250% dividend, ex-date: 11 Feb 26

stock-summary
SPLITS

No Splits history available

stock-summary
BONUS

No Bonus history available

stock-summary
RIGHTS

No Rights history available

stock-summaryKey Factors

Quality key factors stock-summary

Factor
Value
Sales Growth (5y)
15.35%
EBIT Growth (5y)
23.86%
EBIT to Interest (avg)
20.33
Debt to EBITDA (avg)
0.23
Net Debt to Equity (avg)
-0.17
Sales to Capital Employed (avg)
2.90
Tax Ratio
25.55%
Dividend Payout Ratio
72.51%
Pledged Shares
0
Institutional Holding
52.21%
ROCE (avg)
71.73%
ROE (avg)
45.83%

Valuation key factors

Factor
Value
P/E Ratio
51
Industry P/E
50
Price to Book Value
28.10
EV to EBIT
38.43
EV to EBITDA
34.91
EV to Capital Employed
33.64
EV to Sales
7.73
PEG Ratio
3.38
Dividend Yield
1.76%
ROCE (Latest)
85.93%
ROE (Latest)
55.00%

Technicals key factors

Indicator
Weekly
Monthly
MACD
Bearish
Bearish
RSI
No Signal
No Signal
Bollinger Bands
Mildly Bearish
Mildly Bearish
Moving Averages
Mildly Bearish (Daily)
KST
Bearish
Mildly Bearish
Dow Theory
Mildly Bullish
No Trend
OBV
Mildly Bullish
Mildly Bearish
stock-summary Technical Indicator Scale: Bearish, Mildly Bearish, Sideways, Mildly Bullish, Bullish  Turned 
stock-summaryShareholding
Shareholding Snapshot : Dec 2025stock-summary
Shareholding Compare (%holding) stock-summary
Majority shareholders

Promoters

Pledged Promoter Holdings

None

Mutual Funds

Held by 28 Schemes (21.59%)

FIIs

Held by 573 FIIs (20.72%)

Promoter with highest holding

Ramesh Genomal (14.29%)

Highest Public shareholder

Sbi Equity Hybrid Fund (9.04%)

Individual Investors Holdings

3.95%

stock-summaryFinancial
[
  {
    "link": "quarterly",
    "btn_text": "All Quarterly Results",
    "header": "Quarterly Results Snapshot (Standalone) - Dec'25 - QoQ",
    "rhs": [
      {
        "prefix": "Net Sales ",
        "suffix": "QoQ Growth in quarter ended Dec 2025 is 7.43% vs -1.95% in Sep 2025",
        "dir": 1
      },
      {
        "prefix": "Standalone Net Profit ",
        "suffix": "QoQ Growth in quarter ended Dec 2025 is -2.68% vs -3.01% in Sep 2025",
        "dir": 1
      }
    ],
    "table": {
      "header": [
        "Dec'25",
        "Sep'25",
        "Change(%)"
      ],
      "body": [
        {
          "field": "Net Sales",
          "val1": "1,386.76",
          "val2": "1,290.86",
          "chgp": "7.43%",
          "chgp_class": "positive"
        },
        {
          "field": "Operating Profit (PBDIT) excl Other Income",
          "val1": "318.10",
          "val2": "279.52",
          "chgp": "13.80%",
          "chgp_class": "positive"
        },
        {
          "field": "Interest",
          "val1": "12.73",
          "val2": "12.51",
          "chgp": "1.76%",
          "chgp_class": "negative"
        },
        {
          "field": "Exceptional Items",
          "val1": "-35.00",
          "val2": "0.00",
          "chgp": "",
          "chgp_class": "neutral"
        },
        {
          "field": "Standalone Net Profit",
          "val1": "189.54",
          "val2": "194.76",
          "chgp": "-2.68%",
          "chgp_class": "negative"
        },
        {
          "field": "Operating Profit Margin (Excl OI)",
          "val1": "22.94%",
          "val2": "21.65%",
          "chgp": "1.29%",
          "chgp_class": "positive"
        }
      ]
    }
  },
  {
    "link": "half-yearly",
    "btn_text": "All Half Yearly Results",
    "header": "Half Yearly Results Snapshot (Standalone) - Sep'25",
    "rhs": [
      {
        "prefix": "Net Sales ",
        "suffix": " Growth in half year ended Sep 2025 is 3.31% vs 7.05% in Sep 2024",
        "dir": -1
      },
      {
        "prefix": "Standalone Net Profit ",
        "suffix": " Growth in half year ended Sep 2025 is 9.73% vs 16.80% in Sep 2024",
        "dir": -1
      }
    ],
    "table": {
      "header": [
        "Sep'25",
        "Sep'24",
        "Change(%)"
      ],
      "body": [
        {
          "field": "Net Sales",
          "val1": "2,607.42",
          "val2": "2,523.79",
          "chgp": "3.31%",
          "chgp_class": "positive"
        },
        {
          "field": "Operating Profit (PBDIT) excl Other Income",
          "val1": "574.21",
          "val2": "524.82",
          "chgp": "9.41%",
          "chgp_class": "positive"
        },
        {
          "field": "Interest",
          "val1": "25.17",
          "val2": "22.61",
          "chgp": "11.32%",
          "chgp_class": "negative"
        },
        {
          "field": "Exceptional Items",
          "val1": "0.00",
          "val2": "0.00",
          "chgp": "",
          "chgp_class": "neutral"
        },
        {
          "field": "Standalone Net Profit",
          "val1": "395.56",
          "val2": "360.48",
          "chgp": "9.73%",
          "chgp_class": "positive"
        },
        {
          "field": "Operating Profit Margin (Excl OI)",
          "val1": "22.02%",
          "val2": "20.79%",
          "chgp": "1.23%",
          "chgp_class": "positive"
        }
      ]
    }
  },
  {
    "link": "nine-monthly",
    "btn_text": "All Nine Monthly Results",
    "header": "Nine Monthly Results Snapshot (Standalone) - Dec'25",
    "rhs": [
      {
        "prefix": "Net Sales ",
        "suffix": "YoY Growth in nine months ended Dec 2025 is 4.10% vs 7.08% in Dec 2024",
        "dir": -1
      },
      {
        "prefix": "Standalone Net Profit ",
        "suffix": "YoY Growth in nine months ended Dec 2025 is 3.53% vs 22.59% in Dec 2024",
        "dir": -1
      }
    ],
    "table": {
      "header": [
        "Dec'25",
        "Dec'24",
        "Change(%)"
      ],
      "body": [
        {
          "field": "Net Sales",
          "val1": "3,994.18",
          "val2": "3,836.84",
          "chgp": "4.10%",
          "chgp_class": "positive"
        },
        {
          "field": "Operating Profit (PBDIT) excl Other Income",
          "val1": "892.31",
          "val2": "827.33",
          "chgp": "7.85%",
          "chgp_class": "positive"
        },
        {
          "field": "Interest",
          "val1": "37.90",
          "val2": "34.55",
          "chgp": "9.70%",
          "chgp_class": "negative"
        },
        {
          "field": "Exceptional Items",
          "val1": "-35.00",
          "val2": "0.00",
          "chgp": "",
          "chgp_class": "neutral"
        },
        {
          "field": "Standalone Net Profit",
          "val1": "585.10",
          "val2": "565.14",
          "chgp": "3.53%",
          "chgp_class": "positive"
        },
        {
          "field": "Operating Profit Margin (Excl OI)",
          "val1": "22.34%",
          "val2": "21.56%",
          "chgp": "0.78%",
          "chgp_class": "positive"
        }
      ]
    }
  },
  {
    "link": "annual",
    "btn_text": "All Annual Results",
    "header": "Annual Results Snapshot (Standalone) - Mar'25",
    "rhs": [
      {
        "prefix": "Net Sales ",
        "suffix": "YoY Growth in year ended Mar 2025 is 8.00% vs -3.07% in Mar 2024",
        "dir": 1
      },
      {
        "prefix": "Standalone Net Profit ",
        "suffix": "YoY Growth in year ended Mar 2025 is 28.10% vs -0.36% in Mar 2024",
        "dir": 1
      }
    ],
    "table": {
      "header": [
        "Mar'25",
        "Mar'24",
        "Change(%)"
      ],
      "body": [
        {
          "field": "Net Sales",
          "val1": "4,934.91",
          "val2": "4,569.23",
          "chgp": "8.00%",
          "chgp_class": "positive"
        },
        {
          "field": "Operating Profit (PBDIT) excl Other Income",
          "val1": "1,062.55",
          "val2": "859.82",
          "chgp": "23.58%",
          "chgp_class": "positive"
        },
        {
          "field": "Interest",
          "val1": "46.38",
          "val2": "44.89",
          "chgp": "3.32%",
          "chgp_class": "negative"
        },
        {
          "field": "Exceptional Items",
          "val1": "0.00",
          "val2": "0.00",
          "chgp": "",
          "chgp_class": "neutral"
        },
        {
          "field": "Standalone Net Profit",
          "val1": "729.14",
          "val2": "569.19",
          "chgp": "28.10%",
          "chgp_class": "positive"
        },
        {
          "field": "Operating Profit Margin (Excl OI)",
          "val1": "21.53%",
          "val2": "18.82%",
          "chgp": "2.71%",
          "chgp_class": "positive"
        }
      ]
    }
  }
]

Quarterly Results Snapshot (Standalone) - Dec'25 - QoQstock-summary

Dec'25
Sep'25
Change(%)
Net Sales
1,386.76
1,290.86
7.43%
Operating Profit (PBDIT) excl Other Income
318.10
279.52
13.80%
Interest
12.73
12.51
1.76%
Exceptional Items
-35.00
0.00
Standalone Net Profit
189.54
194.76
-2.68%
Operating Profit Margin (Excl OI)
22.94%
21.65%
1.29%
Values in Rs Cr.
Direction Arrows
Net Sales

QoQ Growth in quarter ended Dec 2025 is 7.43% vs -1.95% in Sep 2025

Direction Arrows
Standalone Net Profit

QoQ Growth in quarter ended Dec 2025 is -2.68% vs -3.01% in Sep 2025

Half Yearly Results Snapshot (Standalone) - Sep'25stock-summary

Sep'25
Sep'24
Change(%)
Net Sales
2,607.42
2,523.79
3.31%
Operating Profit (PBDIT) excl Other Income
574.21
524.82
9.41%
Interest
25.17
22.61
11.32%
Exceptional Items
0.00
0.00
Standalone Net Profit
395.56
360.48
9.73%
Operating Profit Margin (Excl OI)
22.02%
20.79%
1.23%
Values in Rs Cr.
Direction Arrows
Net Sales

Growth in half year ended Sep 2025 is 3.31% vs 7.05% in Sep 2024

Direction Arrows
Standalone Net Profit

Growth in half year ended Sep 2025 is 9.73% vs 16.80% in Sep 2024

Nine Monthly Results Snapshot (Standalone) - Dec'25stock-summary

Dec'25
Dec'24
Change(%)
Net Sales
3,994.18
3,836.84
4.10%
Operating Profit (PBDIT) excl Other Income
892.31
827.33
7.85%
Interest
37.90
34.55
9.70%
Exceptional Items
-35.00
0.00
Standalone Net Profit
585.10
565.14
3.53%
Operating Profit Margin (Excl OI)
22.34%
21.56%
0.78%
Values in Rs Cr.
Direction Arrows
Net Sales

YoY Growth in nine months ended Dec 2025 is 4.10% vs 7.08% in Dec 2024

Direction Arrows
Standalone Net Profit

YoY Growth in nine months ended Dec 2025 is 3.53% vs 22.59% in Dec 2024

Annual Results Snapshot (Standalone) - Mar'25stock-summary

Mar'25
Mar'24
Change(%)
Net Sales
4,934.91
4,569.23
8.00%
Operating Profit (PBDIT) excl Other Income
1,062.55
859.82
23.58%
Interest
46.38
44.89
3.32%
Exceptional Items
0.00
0.00
Standalone Net Profit
729.14
569.19
28.10%
Operating Profit Margin (Excl OI)
21.53%
18.82%
2.71%
Values in Rs Cr.
Direction Arrows
Net Sales

YoY Growth in year ended Mar 2025 is 8.00% vs -3.07% in Mar 2024

Direction Arrows
Standalone Net Profit

YoY Growth in year ended Mar 2025 is 28.10% vs -0.36% in Mar 2024

stock-summaryCompany CV
About Page Industries Ltd stock-summary
stock-summary
Page Industries Ltd
Mid Cap
Garments & Apparels
Page Industries Limited, headquartered in Bangalore, was incorporated in 1995. The Company is the exclusive licensee of JOCKEY International Inc. (USA) for the manufacture, distribution, and marketing of the JOCKEY brand in India, Sri Lanka, Bangladesh, Nepal, Oman, Qatar, Maldives, Bhutan, and the UAE. The Company is the exclusive licensee of Speedo International Ltd. for the manufacture, marketing, and distribution of the Speedo brand in India.
Company Coordinates stock-summary
Company Details
Cessna Business Park Tower-1, 7th Floor Umiya Business Bay Bengaluru Karnataka : 560103
stock-summary
Tel: 91-80-49454545
stock-summary
info@jockeyindia.com
Registrar Details
Link Intime India Pvt Ltd, C-13 Pannalal Silk Compound, L B S Marg, Bhandup , Mumbai