
Compare Neelamalai Agro with Similar Stocks
Dashboard
With a Operating Losses, the company has a Weak Long Term Fundamental Strength
- Company's ability to service its debt is weak with a poor EBIT to Interest (avg) ratio of -4.08
- The company has reported losses. Due to this company has reported negative ROCE
Risky - Negative EBITDA
Consistent Underperformance against the benchmark over the last 3 years
Total Returns (Price + Dividend) 
Latest dividend: 30 per share ex-dividend date: Aug-11-2025
Risk Adjusted Returns v/s
Returns Beta

News
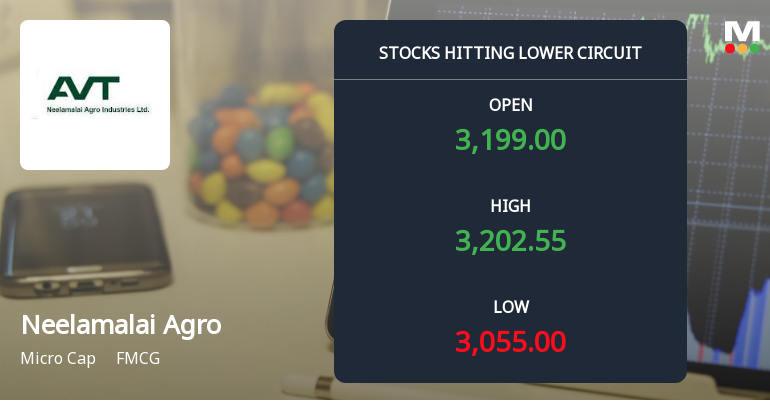
Neelamalai Agro Industries Ltd Locks at Lower Circuit With 5.0% Loss — Sellers Queue, No Buyers in Sight
At Rs 3,040, sellers were still queuing — but there were no buyers willing to take the other side. Neelamalai Agro Industries Ltd locked at its lower circuit of 5.0% on 15 Jun 2026, with unfilled sell orders and a frozen price, signalling persistent selling pressure in a micro-cap stock with limited liquidity.
Read full news article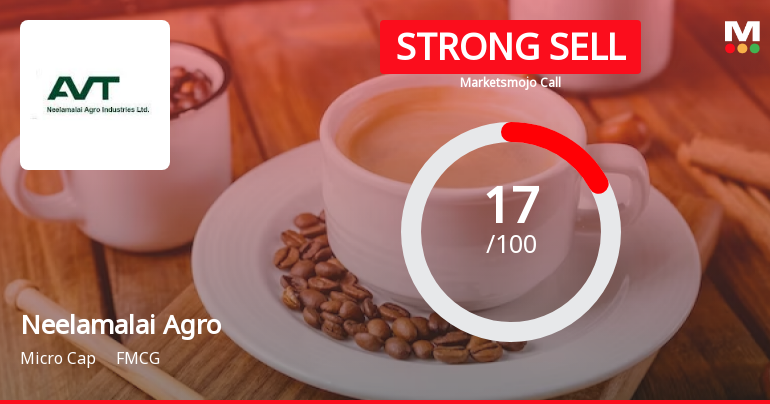
Neelamalai Agro Industries Ltd is Rated Strong Sell
Neelamalai Agro Industries Ltd is rated Strong Sell by MarketsMOJO. This rating was last updated on 19 Nov 2025. However, the analysis and financial metrics presented here reflect the company’s current position as of 12 June 2026, providing investors with the most up-to-date view of its fundamentals, returns, and market performance.
Read full news article
Announcements
Announcement under Regulation 30 (LODR)-Newspaper Publication
01-Jun-2026 | Source : BSENewspaper publication- Extract of Audited Financial Results for the fourth quarter/year ended March 31 2026
Board Meeting Outcome for Outcome Of Board Meeting Held On 29.5.2026
29-May-2026 | Source : BSERegulation 30 & 33 of SEBI (LODR) - Audited Financial Results for the fourth quarter and year ended 31.03.2026 - outcome of Board Meeting dated 29.05.2026
Results - Financial Results For 31.03.2026
29-May-2026 | Source : BSEAudited Financial Results for the year ended 31st March 2026
Corporate Actions

No Upcoming Board Meetings

Neelamalai Agro Industries Ltd has declared 300% dividend, ex-date: 11 Aug 25

No Splits history available

No Bonus history available

No Rights history available
Quality key factors
Valuation key factors
Technicals key factors
 Technical Indicator Scale: Bearish, Mildly Bearish, Sideways, Mildly Bullish, Bullish Turned
 Shareholding Snapshot : Mar 2026
Shareholding Compare (%holding)
Promoters
None
Held by 0 Schemes
Held by 0 FIIs
Ajit Thomas (66.65%)
None
17.39%
Quarterly Results Snapshot (Consolidated) - Mar'26 - QoQ

QoQ Growth in quarter ended Mar 2026 is -2.65% vs 47.23% in Dec 2025
QoQ Growth in quarter ended Mar 2026 is -29.72% vs 75.09% in Dec 2025
Half Yearly Results Snapshot (Consolidated) - Sep'25
Growth in half year ended Sep 2025 is -11.86% vs -1.61% in Sep 2024

Growth in half year ended Sep 2025 is 28.24% vs -52.27% in Sep 2024
Nine Monthly Results Snapshot (Consolidated) - Dec'25
YoY Growth in nine months ended Dec 2025 is -1.12% vs -7.20% in Dec 2024
YoY Growth in nine months ended Dec 2025 is 18.30% vs -39.25% in Dec 2024
Annual Results Snapshot (Consolidated) - Mar'26
YoY Growth in year ended Mar 2026 is 9.51% vs -8.29% in Mar 2025
YoY Growth in year ended Mar 2026 is 25.52% vs -40.56% in Mar 2025
About Neelamalai Agro Industries Ltd

Company Coordinates


