
Compare Lokesh Mach. with Similar Stocks
Dashboard
Weak Long Term Fundamental Strength with an average Return on Capital Employed (ROCE) of 7.86%
- Poor long term growth as Net Sales has grown by an annual rate of 6.78% and Operating profit at 6.44% over the last 5 years
- Low ability to service debt as the company has a high Debt to EBITDA ratio of 6.06 times
With a growth in Net Profit of 241.27%, the company declared Very Positive results in Mar 26
With ROCE of 3.1, it has a Expensive valuation with a 2 Enterprise value to Capital Employed
Market Beating performance in long term as well as near term
Stock DNA
Industrial Manufacturing
INR 637 Cr (Micro Cap)
157.00
38
0.00%
0.67
1.71%
2.70
Total Returns (Price + Dividend) 
Latest dividend: 0.5 per share ex-dividend date: Sep-22-2016
Risk Adjusted Returns v/s
Returns Beta

News
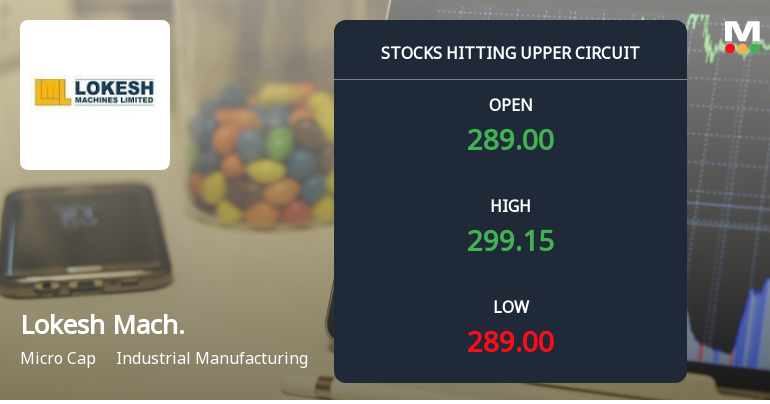
Lokesh Machines Ltd Locks at Upper Circuit With 4.99% Gain — Buyers Queue, Sellers Absent
At Rs 297.7, the buying was done — not because demand dried up, but because the exchange wouldn't let the stock go any higher. Lokesh Machines Ltd locked at its upper circuit of 4.99% on 23 Jun 2026, with buyers queuing and no sellers willing to part with shares.
Read full news article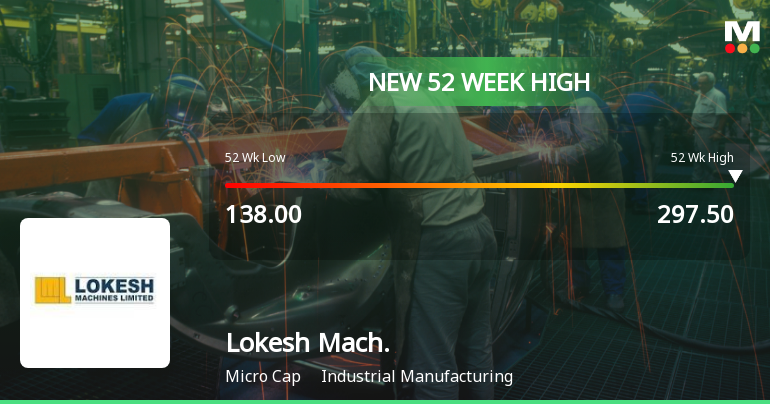
Broad-Based Technical Strength Lifts Lokesh Machines Ltd to 52-Week High of Rs 296.25
Surging past its previous peaks, Lokesh Machines Ltd touched a fresh 52-week high of Rs 296.25 on 23 Jun 2026, marking a remarkable 72.97% gain over the past year. This milestone reflects a sustained momentum driven by a confluence of bullish technical indicators and robust price action.
Read full news article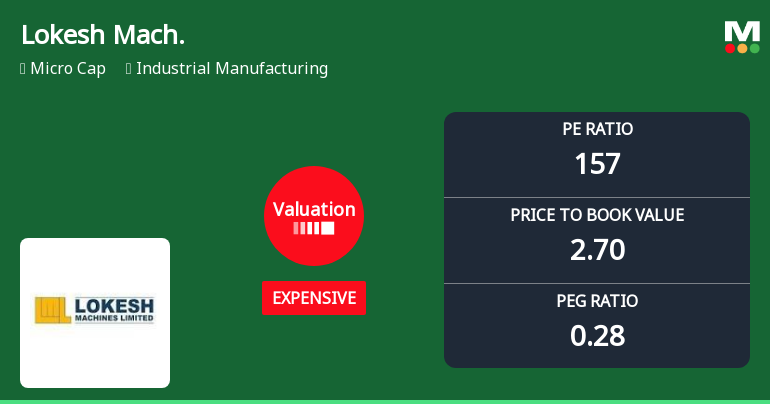
Lokesh Machines Ltd Valuation Shifts Signal Changing Market Sentiment
Lokesh Machines Ltd has witnessed a significant shift in its valuation parameters, moving from a fair to an expensive rating, reflecting evolving investor perceptions amid robust price gains and mixed financial metrics. This article analyses the recent valuation changes, compares them with peer averages and historical benchmarks, and assesses the implications for investors.
Read full news article Announcements
Intimation Of Receipt Of Listing Approval From BSE Limited And National Stock Exchange Of India Limited For 1300000 Equity Shares Allotted On Preferential Basis.
19-Jun-2026 | Source : BSEEnclosed.
Announcement under Regulation 30 (LODR)-Newspaper Publication
27-May-2026 | Source : BSENews Paper Publication- Financial Results
Board Meeting Outcome for Outcome Of Board Meeting Held On May 26 2026 And Submission Of Audited Financial Results For The Quarter And Year Ended March 31 2026
26-May-2026 | Source : BSEEnclosed
Corporate Actions

No Upcoming Board Meetings

Lokesh Machines Ltd has declared 5% dividend, ex-date: 22 Sep 16

No Splits history available

No Bonus history available

No Rights history available
Quality key factors
Valuation key factors
Technicals key factors
 Technical Indicator Scale: Bearish, Mildly Bearish, Sideways, Mildly Bullish, Bullish Turned
 Shareholding Snapshot : May 2026
Shareholding Compare (%holding)
Promoters
15.3296
Held by 0 Schemes
Held by 0 FIIs
Srinivas Mullapudi (12.28%)
Zenila Ventures Llp (2.82%)
40.74%
Quarterly Results Snapshot (Standalone) - Mar'26 - QoQ

QoQ Growth in quarter ended Mar 2026 is 17.01% vs 0.59% in Dec 2025
QoQ Growth in quarter ended Mar 2026 is 241.27% vs 0.00% in Dec 2025
Half Yearly Results Snapshot (Standalone) - Sep'25

Growth in half year ended Sep 2025 is -28.55% vs 8.78% in Sep 2024
Growth in half year ended Sep 2025 is -76.11% vs 11.60% in Sep 2024
Nine Monthly Results Snapshot (Standalone) - Dec'25
YoY Growth in nine months ended Dec 2025 is -21.32% vs -11.06% in Dec 2024
YoY Growth in nine months ended Dec 2025 is 307.14% vs -95.41% in Dec 2024
Annual Results Snapshot (Standalone) - Mar'26
YoY Growth in year ended Mar 2026 is -8.65% vs -22.22% in Mar 2025
YoY Growth in year ended Mar 2026 is 614.81% vs -96.10% in Mar 2025
About Lokesh Machines Ltd

Company Coordinates


