
Compare 10X Genomics, Inc. with Similar Stocks
Stock DNA
Pharmaceuticals & Biotechnology
USD 2,642 Million (Small Cap)
NA (Loss Making)
NA
0.00%
-0.60
-15.69%
3.36
Total Returns (Price + Dividend) 
10X Genomics, Inc. for the last several years.
Risk Adjusted Returns v/s
News
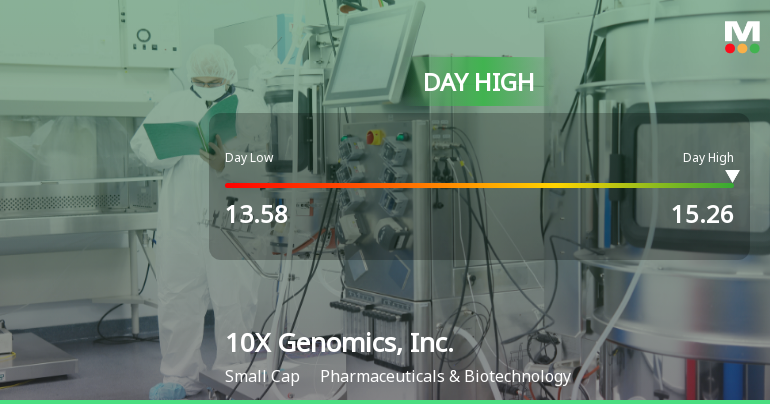
10X Genomics Stock Soars 17.31%, Hits Intraday High of $15.26
10X Genomics, Inc. saw a notable stock price increase on November 7, 2025, amid a modest rise in the broader market. The company has shown strong weekly and monthly performance, despite a decline over the past year. High institutional ownership reflects investor confidence, while challenges remain with negative EBITDA.
Read full news article
10X Genomics Hits Day High with 9.65% Surge in Intraday Performance
10X Genomics, Inc. experienced a notable stock price increase on October 31, 2025, despite facing a challenging year with a significant decline. The company has high institutional ownership but struggles with negative financial metrics, indicating ongoing profitability issues amid a volatile market environment.
Read full news article Announcements

Corporate Actions
Quality key factors
Valuation key factors
Technicals key factors
 Technical Indicator Scale: Bearish, Mildly Bearish, Sideways, Mildly Bullish, Bullish Turned
 Shareholding Snapshot : Sep 2025
Shareholding Compare (%holding)
Domestic Funds
Held in 70 Schemes (61.52%)
Held by 166 Foreign Institutions (24.9%)
Quarterly Results Snapshot (Consolidated) - Sep'25 - YoY

YoY Growth in quarter ended Sep 2025 is -1.78% vs -1.24% in Sep 2024
YoY Growth in quarter ended Sep 2025 is 23.18% vs 61.51% in Sep 2024
Annual Results Snapshot (Consolidated) - Dec'24
YoY Growth in year ended Dec 2024 is -1.28% vs 19.81% in Dec 2023

YoY Growth in year ended Dec 2024 is 28.42% vs -53.67% in Dec 2023
About 10X Genomics, Inc.

Company Coordinates


