63 Moons Tech.

  • Market Cap: Small Cap
  • Industry: Computers - Software & Consulting
  • ISIN: INE111B01023
  • NSEID: 63MOONS
  • BSEID: 526881
INR
884.85
11.3 (1.29%)
BSENSE

Sep 18, 03:30 PM

BSE+NSE Vol: 2.44 lacs

  • Price Points
  • Score
  • Mojo Parameters
  • Total Return
  • News and Corporate Actions
  • Key factors
  • Shareholding
  • Financials
  • CompanyCV
stock-summaryPrice Point
High/Low

1Day

52 Week

Valuation
Technical
Day's Volume

CASH

2.44 lacs (-52.80%) Volume

Shareholding (Jun 2026)

FII

1.61%

Held by 42 FIIs

DII

0.01%

Held by 0 DIIs

Promoter

45.63%

Why is 63 Moons Technologies Ltd falling/rising?

06-Sep-2026

As of 05-Sep, 63 Moons Technologies Ltd's stock price has risen to Rs 875.20, up 2.86%, driven by strong recent performance and increased investor interest. Despite positive short-term metrics, the company faces challenges like operating losses and weak long-term fundamentals.

As of 05-Sep, 63 Moons Technologies Ltd is experiencing a rise in its stock price, currently at Rs 875.20, reflecting an increase of Rs 24.35 or 2.86%. This upward movement can be attributed to several factors. The stock has outperformed the sector by 3.05% today and has been on a consecutive gain streak for the last three days, accumulating a total return of 12.63% during this period. Additionally, the stock opened with a notable gain of 3.29% today and reached an intraday high of Rs 903, which is a 6.13% increase.<BR><BR>The stock's performance is further supported by its trading position above key moving averages, including the 5-day, 20-day, 50-day, 100-day, and 200-day averages. There has also been a significant increase in investor participation, with delivery volume rising by 119.49% against the 5-day average, indicating heightened interest from investors. Moreover, the company has reported positive results for the last three consecutive quarters, with net sales growing at an impressive rate of 514.56% over the latest six months.<BR><BR>However, it is important to note that despite these positive indicators, the company faces challenges such as operating losses and a weak long-term fundamental strength, which may affect its future performance. Nonetheless, the current stock price rise is primarily driven by strong recent performance metrics and increased investor engagement.

View full answer

Who are in the management team of 63 Moons Tech.?

01-Sep-2026

The management team of 63 Moons Tech includes Chairman Venkat Chary, Managing Director & CEO Rajendran Soundaram, and several independent and non-executive directors, totaling 12 key members who guide the company's strategic direction.

The management team of 63 Moons Tech includes the following individuals:<BR><BR>1. **Venkat Chary** - Chairman & Independent Director<BR>2. **Deepak Verma** - Independent Non-Executive Director<BR>3. **Chitkala Zutshi** - Independent Non-Executive Director<BR>4. **Suresh Salvi** - Independent Non-Executive Director<BR>5. **Chandrasekhar Kanekal** - Independent Non-Executive Director<BR>6. **Sunil Shah** - Non-Executive & Non-Independent Director<BR>7. **Devender Singh Rawat** - Non-Executive & Non-Independent Director<BR>8. **Rajendran Soundaram** - Managing Director & CEO<BR>9. **Devendra Agrawal** - Executive Director / Whole Time Director<BR>10. **Satyananda Mishra** - Nominee<BR>11. **Malini Vijay Shankar** - Nominee<BR>12. **P K Gupta** - Nominee<BR><BR>This diverse team plays a crucial role in guiding the company's strategic direction and operations.

View full answer

What does 63 Moons Tech. do?

01-Sep-2026

63 Moons Technologies Ltd is a small-cap company in the software and consulting industry, reporting net sales of 137 Cr and a net loss of 40 Cr for June 2026. The company, formerly known as Worldwide Technologies Limited, was renamed in 2016 and has a market cap of INR 3,534 Cr.

Overview:<BR>63 Moons Technologies Ltd operates in the Computers - Software & Consulting industry and is categorized as a Small Cap company.<BR><BR>History:<BR>The company was initially incorporated as 'Worldwide Technologies Limited' in 1988, underwent several name changes, and was last renamed to '63 Moons Technologies Limited' on May 27, 2016. The latest quarterly results reported net sales and profit for June 2026.<BR><BR>Financial Snapshot:<BR>Most recent Net Sales: 137 Cr (Quarterly Results - Jun 2026) <BR>Most recent Net Profit: -40 Cr (Quarterly Results - Jun 2026) <BR>Market-cap value: INR 3,534 Cr (Small Cap)<BR><BR>Key Metrics:<BR>P/E: N/A <BR>Industry P/E: 22 <BR>Dividend Yield: 0.15% <BR>Debt-Equity: -0.55 <BR>Return on Equity: -2.66% <BR>Price to Book: 1.01<BR><BR>Contact Details:<BR>Address: Shakti Tower-1, Premises E, 766 Anna Salai Thousand Lights Chennai Tamil Nadu : 600002 <BR>Tel: 91-44-43950850/51 <BR>Email: info@ftindia.com <BR>Website: http://www.63moons.com

View full answer

Who are the peers of the 63 Moons Tech.?

01-Sep-2026

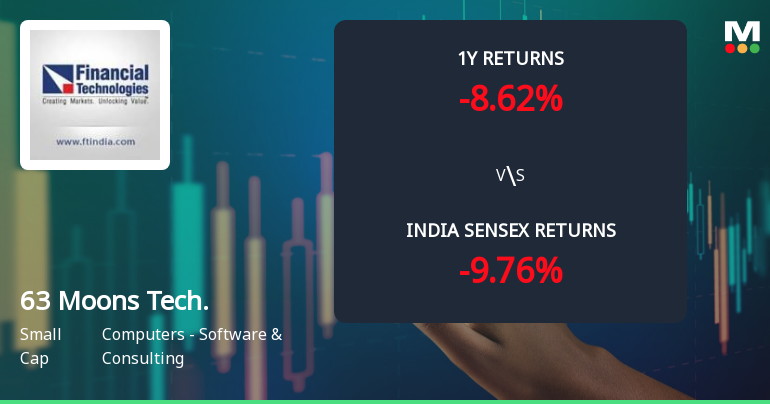
Peers of 63 Moons Tech. include Mastek, Datamatics Glob., eMudhra, Aurionpro Sol., Network People, BLS E-Services, R Systems Intl., Sasken Technol., and Zaggle Prepaid. 63 Moons Tech. has below average management risk and capital structure, with a 1-year return of -13.81%.

Peers: The peers of 63 Moons Tech. are Mastek, Datamatics Glob., eMudhra, Aurionpro Sol., Network People, BLS E-Services, R Systems Intl., Sasken Technol., and Zaggle Prepaid.<BR><BR>Quality Snapshot: Excellent management risk is observed at eMudhra, Network People, and R Systems Intl., while Good management risk is found at Mastek and the rest. Average management risk is present at Datamatics Glob., Aurionpro Sol., BLS E-Services, and Sasken Technol., while Below Average management risk is noted for 63 Moons Tech. and Zaggle Prepaid. Growth is Excellent at eMudhra, Aurionpro Sol., Network People, and BLS E-Services, while Good growth is seen at eMudhra, and Below Average growth is noted for Mastek, Datamatics Glob., 63 Moons Tech., and Sasken Technol. Capital Structure is Excellent for Mastek, Datamatics Glob., eMudhra, Aurionpro Sol., Network People, BLS E-Services, R Systems Intl., and Sasken Technol., while Below Average capital structure is observed at 63 Moons Tech. and Zaggle Prepaid.<BR><BR>Return Snapshot: The peer with the highest 1-year return is BLS E-Services at 84.53%, while the lowest is Aurionpro Sol. at -46.43%. 63 Moons Tech.'s 1-year return of -13.81% is better than Aurionpro Sol. but worse than BLS E-Services. Additionally, R Systems Intl. and Zaggle Prepaid have negative six-month returns.

View full answer

How big is 63 Moons Tech.?

01-Sep-2026

As of 31st August, 63 Moons Technologies Ltd has a market capitalization of 3,534.00 Cr, with recent net sales of 318.30 Cr and a net profit loss of 65.19 Cr over the last four quarters.

As of 31st August, 3:30 PM, <BR><BR>Market Cap: 63 Moons Technologies Ltd has a market capitalization of 3,534.00 Cr, categorizing it as a Small Cap company.<BR><BR>Recent Quarterly Performance: The sum of Net Sales for the latest 4 quarters is 318.30 Cr, while the sum of Net Profit for the same period reflects a loss of 65.19 Cr.<BR><BR>Balance Sheet Snapshot: The reporting period for the balance sheet is March 2025, with Shareholder's Funds amounting to 3,414.34 Cr and Total Assets totaling 3,633.33 Cr.

View full answer

Should I buy, sell or hold 63 Moons Technologies Ltd?

14-Aug-2026

When is the next results date for 63 Moons Technologies Ltd?

06-Aug-2026

The next results date for 63 Moons Technologies Ltd is 12 August 2026.

The next results date for 63 Moons Technologies Ltd is scheduled for 12 August 2026.

View full answer

Are 63 Moons Technologies Ltd latest results good or bad?

20-May-2026

63 Moons Technologies Ltd's latest results show impressive revenue growth with a 397.92% increase in net sales and a 213.92% rise in net profit. However, the company faces significant operational challenges, reflected in a negative operating margin of -57.30%, raising concerns about long-term sustainability despite the strong sales figures.

The latest results for 63 Moons Technologies Ltd present a mixed picture. On one hand, the company achieved a remarkable 397.92% quarter-on-quarter growth in net sales, reaching ₹133.74 crores, and a consolidated net profit of ₹22.50 crores, which is a significant improvement of 213.92% compared to the previous quarter. This surge in revenue marks the highest sales figure in the company’s recent history and reflects a strong year-on-year growth of 881.22%.<BR><BR>However, despite these impressive top-line figures, there are serious concerns regarding the company's operational performance. The operating margin (excluding other income) remains deeply negative at -57.30%, indicating ongoing challenges in generating profits from core operations. The profitability in this quarter was heavily reliant on other income, which contributed ₹24.31 crores, highlighting a structural dependency that raises questions about sustainability.<BR><BR>Overall, while the revenue growth is certainly a positive sign, the persistent operational losses and reliance on non-operating income suggest that the underlying business model faces significant challenges. Therefore, the results can be viewed as good in terms of revenue growth but bad when considering the operational viability and long-term sustainability of profits.

View full answer

Is 63 Moons Tech. technically bullish or bearish?

29-Nov-2025

As of November 28, 2025, 63 Moons Tech shows a mildly bearish trend with mixed signals, as weekly and monthly MACD and KST indicate bearish conditions, while Bollinger Bands and weekly OBV suggest some underlying strength, warranting a cautious approach.

As of 28 November 2025, the technical trend for 63 Moons Tech has changed from bearish to mildly bearish. The current technical stance is mildly bearish, driven by the weekly MACD and KST both indicating bearish conditions, while the monthly MACD and KST are mildly bearish. The daily moving averages also reflect a mildly bearish outlook. However, Bollinger Bands are bullish on both weekly and monthly time frames, and the weekly OBV shows a mildly bullish trend, suggesting some underlying strength. Overall, the mixed signals indicate a cautious approach is warranted.

View full answer

How has been the historical performance of 63 Moons Tech.?

29-Oct-2025

63 Moons Tech. experienced significant financial volatility, with net sales and profitability sharply declining in March 2025, resulting in a loss of 56.24 crore after a profit of 205.22 crore in the previous year. Total assets and liabilities increased slightly, but cash flow from operations was negative at -142 crore, indicating a challenging financial environment.

Answer:<BR>The historical performance of 63 Moons Tech. has shown significant fluctuations over the years, particularly in net sales and profitability. In March 2025, net sales dropped to 46.82 crore from 368.84 crore in March 2024, which was a substantial increase from 290.07 crore in March 2023. The total operating income followed a similar trend, decreasing to 46.82 crore in March 2025 from 368.84 crore in the previous year. Operating profit (PBDIT) saw a decline, resulting in a loss of 48.96 crore in March 2025 compared to a profit of 232.10 crore in March 2024. The profit before tax also turned negative, recording a loss of 55.36 crore in March 2025, down from a profit of 203.84 crore in March 2024. Consequently, the profit after tax for March 2025 was -56.24 crore, a stark contrast to the profit of 205.22 crore in March 2024. The earnings per share (EPS) reflected this downturn, falling to -7.2 in March 2025 from 48.27 in March 2024. <BR><BR>In terms of assets and liabilities, total assets increased slightly to 3,633.33 crore in March 2025 from 3,600.14 crore in March 2024, while total liabilities also rose to 3,633.33 crore from 3,600.14 crore in the same period. Cash flow from operating activities was negative at -142 crore in March 2025, compared to a positive cash flow of 47 crore in March 2024. The closing cash and cash equivalents decreased to 70 crore in March 2025 from 95 crore in March 2024, indicating a tightening liquidity position. Overall, the financial performance of 63 Moons Tech. in recent years has been marked by volatility, with significant losses in the latest fiscal year following a period of profitability.<BR><BR>Breakdown:<BR>The financial trajectory of 63 Moons Tech. has been characterized by dramatic shifts, particularly evident in net sales, which plummeted to 46.82 crore in March 2025 from 368.84 crore in March 2024. This decline was mirrored in total operating income, which also fell to 46.82 crore. Operating profit turned negative, resulting in a loss of 48.96 crore in March 2025, a stark contrast to the profit of 232.10 crore in the prior year. Profit before tax followed suit, dropping to -55.36 crore from a profit of 203.84 crore, leading to a profit after tax of -56.24 crore in March 2025, down from 205.22 crore. The earnings per share reflected this downturn, falling to -7.2. Despite a slight increase in total assets to 3,633.33 crore, total liabilities also rose correspondingly. Cash flow from operating activities was negative at -142 crore, and closing cash and cash equivalents decreased to 70 crore, indicating a challenging financial environment for the company.

View full answer

Is 63 Moons Tech. overvalued or undervalued?

09-Jun-2025

As of August 13, 2024, 63 Moons Technologies is considered risky and overvalued with poor financial metrics, including a PE ratio of -73.30 and an EV to EBITDA of -7.91, especially when compared to peers like TCS and Infosys, despite a strong one-year stock return of 150.73%.

As of 13 August 2024, the valuation grade for 63 Moons Technologies has moved from very attractive to risky, indicating a significant deterioration in its valuation outlook. The company appears to be overvalued based on its current metrics, with a price-to-earnings (PE) ratio of -73.30, an EV to EBITDA of -7.91, and a return on equity (ROE) of -1.55%. These ratios suggest that the company is struggling to generate profits and is not performing well compared to its peers.<BR><BR>In comparison, notable peers such as TCS and Infosys have PE ratios of 25.23 and 24.32, respectively, highlighting a stark contrast in valuation. Additionally, while 63 Moons Tech has a PEG ratio of 0.00, indicating no growth expectations, TCS and Infosys have PEG ratios of 6.1 and 13.91, respectively, suggesting they are expected to grow. Despite a strong one-year stock return of 150.73% compared to the Sensex's 7.62%, the underlying financial ratios and peer comparisons indicate that 63 Moons Technologies is overvalued in the current market environment.

View full answer

Who are the top shareholders of the 63 Moons Tech.?

06-Jun-2025

The top shareholders of 63 Moons Tech. include La-fin Financial Services Pvt Ltd with 26.76%, public shareholder Ravi Kanaiyalal Sheth with 7.19%, and individual investors holding 43.33%. Additionally, 34 Foreign Institutional Investors own 1.41% of the shares, with no mutual funds currently invested.

The top shareholders of 63 Moons Tech. are primarily non-institutional investors. The promoter with the highest holding is La-fin Financial Services Pvt Ltd, which holds 26.76% of the shares. The highest public shareholder is Ravi Kanaiyalal Sheth, who owns 7.19%. Additionally, individual investors collectively hold 43.33% of the company's shares. There are also 34 Foreign Institutional Investors (FIIs) that hold a total of 1.41% of the shares, but no mutual funds are currently invested in the company.

View full answer

Has 63 Moons Tech. declared dividend?

06-Jun-2025

Yes, 63 Moons Technologies Ltd has declared a 100% dividend, amounting to ₹2 per share, with an ex-date of September 20, 2024. The company has shown strong total returns over various periods, with significant price appreciation and increasing dividend contributions.

63 Moons Technologies Ltd has declared a 100% dividend.<BR><BR>Dividend Details:<BR>- Percentage announced: 100%<BR>- Amount per share: 2<BR>- Ex-date: 20 Sep 2024<BR><BR>Dividend Yield: 0.23%.<BR><BR>Total Returns by Period:<BR>In the last 6 months, the price return was 6.11%, with no dividend return, resulting in a total return of 6.11%.<BR><BR>Over the past year, the price return was 144.6%, with a dividend return of 0.56%, leading to a total return of 145.16%.<BR><BR>For the 2-year period, the price return was 413.66%, with a dividend return of 2.34%, culminating in a total return of 416.0%.<BR><BR>In the 3-year span, the price return was 406.56%, with a dividend return of 2.56%, resulting in a total return of 409.12%.<BR><BR>Over the last 4 years, the price return was 846.24%, with a dividend return of 6.41%, leading to a total return of 852.65%.<BR><BR>In the 5-year period, the price return was 1222.06%, with a dividend return of 10.60%, resulting in a total return of 1232.66%.<BR><BR>Overall, 63 Moons Technologies Ltd has declared a substantial dividend, and the total returns over various periods indicate strong performance, particularly in price appreciation, with increasing contributions from dividends over time.

View full answer
iScoreScore
Click here to find our call on this stock
Strong Sell
Sell
Hold
Buy
Strong Buy

Dashboard

1

With a Operating Losses, the company has a Weak Long Term Fundamental Strength

  • Company's ability to service its debt is weak with a poor EBIT to Interest (avg) ratio of -127.91
  • The company has been able to generate a Return on Equity (avg) of 1.46% signifying low profitability per unit of shareholders funds
2

Risky - Negative EBITDA

3

Despite the size of the company, domestic mutual funds hold only 0% of the company

stock-summaryMojo Parameters

Mojo Parameters

Loading Valuation Snapshot...

Stock DNA

stock-summary
Industry

Computers - Software & Consulting

stock-summary
Market cap

INR 4,064 Cr (Small Cap)

stock-summary
P/E

NA (Loss Making)

stock-summary
Industry P/E

20

stock-summary
Dividend Yield

0.37%

stock-summary
Debt Equity

-0.55

stock-summary
Return on Equity

-2.66%

stock-summary
Price to Book

1.13

Revenue and Profits:
Net Sales:
137 Cr
(Quarterly Results - Jun 2026)
Net Profit:
-40 Cr
stock-summaryTotal Returns
Total Returns (Price + Dividend) stock-summary
Dividend Yield (0.37%)
TimePeriod
Price Return
Dividend Return
Total Return
3 Months
32.41%
0.30%
32.71%
6 Months
58.67%
0.42%
59.09%
1 Year
-4.18%
0.22%
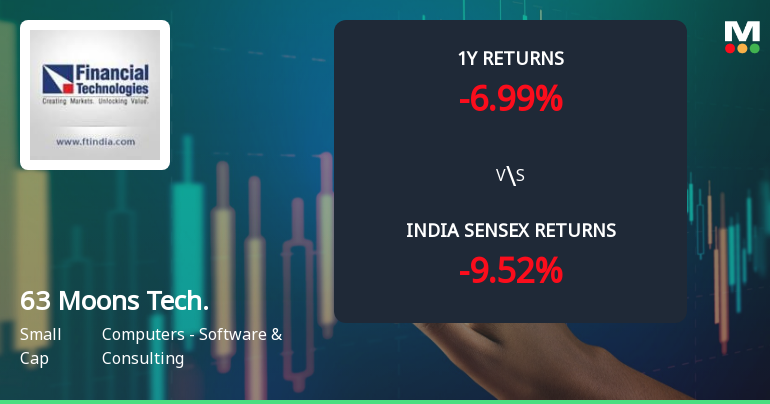
-3.96%
2 Years
118.94%
0.83%
119.77%
3 Years
198.28%
1.93%
200.21%
4 Years
394.47%
3.96%
398.43%
5 Years
834.87%
7.10%
841.97%

Latest dividend: 2.0204518430439955 per share ex-dividend date: Sep-16-2026

Risk Adjusted Returns v/s stock-summary
Returns Beta
Icon
Beta has not been calculated since enough price history is not available
stock-summaryNews & Corporate Actions

News

Announcements stock-summary

Update - Restructuring Of Non-Material Subsidiary - Ticker Limited

09-Sep-2026 | Source : BSE

Update - Restructuring of non-material subsidiary - Ticker Limited

Announcement under Regulation 30 (LODR)-Updates on Acquisition

07-Sep-2026 | Source : BSE

Update on Acquisition

Announcement under Regulation 30 (LODR)-Newspaper Publication

02-Sep-2026 | Source : BSE

Newspaper Advertisement - Special Window for transfer and dematerialisation of physical securities

Corporate Actions stock-summary

stock-summary
BOARD MEETING

No Upcoming Board Meetings

stock-summary
DIVIDEND

63 Moons Technologies Ltd has declared 100% dividend, ex-date: 16 Sep 26

stock-summary
SPLITS

No Splits history available

stock-summary
BONUS

No Bonus history available

stock-summary
RIGHTS

No Rights history available

stock-summaryKey Factors

Quality key factors stock-summary

Factor
Value
Sales Growth (5y)
14.43%
EBIT Growth (5y)
-204.71%
EBIT to Interest (avg)
-127.91
Debt to EBITDA (avg)
Negative Net Debt
Net Debt to Equity (avg)
-0.55
Sales to Capital Employed (avg)
0.07
Tax Ratio
16.89%
Dividend Payout Ratio
-16.67%
Pledged Shares
0
Institutional Holding
1.62%
ROCE (avg)
-9.13%
ROE (avg)
1.46%

Valuation key factors

Factor
Value
P/E Ratio
NA (Loss Making)
Industry P/E
20
Price to Book Value
1.15
EV to EBIT
-6.39
EV to EBITDA
-7.12
EV to Capital Employed
1.33
EV to Sales
6.67
PEG Ratio
NA
Dividend Yield
0.23%
ROCE (Latest)
-19.66%
ROE (Latest)
-2.66%

Technicals key factors

Indicator
Weekly
Monthly
MACD
Bullish
Mildly Bearish
RSI
No Signal
No Signal
Bollinger Bands
Mildly Bullish
Bullish
Moving Averages
Bullish (Daily)
KST
Bullish
Mildly Bearish
Dow Theory
Mildly Bullish
No Trend
OBV
No Trend
Mildly Bullish
stock-summary Technical Indicator Scale: Bearish, Mildly Bearish, Sideways, Mildly Bullish, Bullish  Turned 
stock-summaryShareholding
Shareholding Snapshot : Jun 2026stock-summary
Shareholding Compare (%holding) stock-summary
Majority shareholders

Non Institution

Pledged Promoter Holdings

None

Mutual Funds

Held by 1 Schemes (0.0%)

FIIs

Held by 42 FIIs (1.61%)

Promoter with highest holding

La-fin Financial Services Pvt Ltd (26.76%)

Highest Public shareholder

Ravi Kanaiyalal Sheth (7.19%)

Individual Investors Holdings

43.28%

stock-summaryFinancial
[
  {
    "link": "quarterly",
    "btn_text": "All Quarterly Results",
    "header": "Quarterly Results Snapshot (Consolidated) - Jun'26 - QoQ",
    "rhs": [
      {
        "prefix": "Net Sales ",
        "suffix": "QoQ Growth in quarter ended Jun 2026 is 2.56% vs 397.92% in Mar 2026",
        "dir": -1
      },
      {
        "prefix": "Consolidated Net Profit ",
        "suffix": "QoQ Growth in quarter ended Jun 2026 is -276.36% vs 213.92% in Mar 2026",
        "dir": -1
      }
    ],
    "table": {
      "header": [
        "Jun'26",
        "Mar'26",
        "Change(%)"
      ],
      "body": [
        {
          "field": "Net Sales",
          "val1": "137.16",
          "val2": "133.74",
          "chgp": "2.56%",
          "chgp_class": "positive"
        },
        {
          "field": "Operating Profit (PBDIT) excl Other Income",
          "val1": "-71.73",
          "val2": "-76.35",
          "chgp": "6.05%",
          "chgp_class": "positive"
        },
        {
          "field": "Interest",
          "val1": "0.33",
          "val2": "0.32",
          "chgp": "3.13%",
          "chgp_class": "negative"
        },
        {
          "field": "Exceptional Items",
          "val1": "0.00",
          "val2": "94.72",
          "chgp": "-100.00%",
          "chgp_class": "negative"
        },
        {
          "field": "Consolidate Net Profit",
          "val1": "-39.68",
          "val2": "22.50",
          "chgp": "-276.36%",
          "chgp_class": "negative"
        },
        {
          "field": "Operating Profit Margin (Excl OI)",
          "val1": "-52.62%",
          "val2": "-57.30%",
          "chgp": "4.68%",
          "chgp_class": "positive"
        }
      ]
    }
  },
  {
    "link": "half-yearly",
    "btn_text": "All Half Yearly Results",
    "header": "Half Yearly Results Snapshot (Consolidated) - Sep'25",
    "rhs": [
      {
        "prefix": "Net Sales ",
        "suffix": " Growth in half year ended Sep 2025 is 138.16% vs -92.18% in Sep 2024",
        "dir": 1
      },
      {
        "prefix": "Consolidated Net Profit ",
        "suffix": " Growth in half year ended Sep 2025 is 8.40% vs -122.58% in Sep 2024",
        "dir": 1
      }
    ],
    "table": {
      "header": [
        "Sep'25",
        "Sep'24",
        "Change(%)"
      ],
      "body": [
        {
          "field": "Net Sales",
          "val1": "50.99",
          "val2": "21.41",
          "chgp": "138.16%",
          "chgp_class": "positive"
        },
        {
          "field": "Operating Profit (PBDIT) excl Other Income",
          "val1": "-141.69",
          "val2": "-115.10",
          "chgp": "-23.10%",
          "chgp_class": "negative"
        },
        {
          "field": "Interest",
          "val1": "0.74",
          "val2": "0.29",
          "chgp": "155.17%",
          "chgp_class": "negative"
        },
        {
          "field": "Exceptional Items",
          "val1": "1.23",
          "val2": "6.12",
          "chgp": "-79.90%",
          "chgp_class": "negative"
        },
        {
          "field": "Consolidate Net Profit",
          "val1": "-25.18",
          "val2": "-27.49",
          "chgp": "8.40%",
          "chgp_class": "positive"
        },
        {
          "field": "Operating Profit Margin (Excl OI)",
          "val1": "-279.19%",
          "val2": "-539.11%",
          "chgp": "259.92%",
          "chgp_class": "positive"
        }
      ]
    }
  },
  {
    "link": "nine-monthly",
    "btn_text": "All Nine Monthly Results",
    "header": "Nine Monthly Results Snapshot (Consolidated) - Dec'25",
    "rhs": [
      {
        "prefix": "Net Sales ",
        "suffix": "YoY Growth in nine months ended Dec 2025 is 134.56% vs -91.88% in Dec 2024",
        "dir": 1
      },
      {
        "prefix": "Consolidated Net Profit ",
        "suffix": "YoY Growth in nine months ended Dec 2025 is -1.72% vs -120.59% in Dec 2024",
        "dir": 1
      }
    ],
    "table": {
      "header": [
        "Dec'25",
        "Dec'24",
        "Change(%)"
      ],
      "body": [
        {
          "field": "Net Sales",
          "val1": "77.85",
          "val2": "33.19",
          "chgp": "134.56%",
          "chgp_class": "positive"
        },
        {
          "field": "Operating Profit (PBDIT) excl Other Income",
          "val1": "-205.35",
          "val2": "-176.37",
          "chgp": "-16.43%",
          "chgp_class": "negative"
        },
        {
          "field": "Interest",
          "val1": "1.08",
          "val2": "0.43",
          "chgp": "151.16%",
          "chgp_class": "negative"
        },
        {
          "field": "Exceptional Items",
          "val1": "1.23",
          "val2": "9.35",
          "chgp": "-86.84%",
          "chgp_class": "negative"
        },
        {
          "field": "Consolidate Net Profit",
          "val1": "-44.93",
          "val2": "-44.17",
          "chgp": "-1.72%",
          "chgp_class": "negative"
        },
        {
          "field": "Operating Profit Margin (Excl OI)",
          "val1": "-263.78%",
          "val2": "-531.39%",
          "chgp": "267.61%",
          "chgp_class": "positive"
        }
      ]
    }
  },
  {
    "link": "annual",
    "btn_text": "All Annual Results",
    "header": "Annual Results Snapshot (Consolidated) - Mar'26",
    "rhs": [
      {
        "prefix": "Net Sales ",
        "suffix": "YoY Growth in year ended Mar 2026 is 351.92% vs -87.31% in Mar 2025",
        "dir": 1
      },
      {
        "prefix": "Consolidated Net Profit ",
        "suffix": "YoY Growth in year ended Mar 2026 is 32.38% vs -114.91% in Mar 2025",
        "dir": 1
      }
    ],
    "table": {
      "header": [
        "Mar'26",
        "Mar'25",
        "Change(%)"
      ],
      "body": [
        {
          "field": "Net Sales",
          "val1": "211.59",
          "val2": "46.82",
          "chgp": "351.92%",
          "chgp_class": "positive"
        },
        {
          "field": "Operating Profit (PBDIT) excl Other Income",
          "val1": "-281.70",
          "val2": "-238.23",
          "chgp": "-18.25%",
          "chgp_class": "negative"
        },
        {
          "field": "Interest",
          "val1": "1.40",
          "val2": "0.67",
          "chgp": "108.96%",
          "chgp_class": "negative"
        },
        {
          "field": "Exceptional Items",
          "val1": "95.95",
          "val2": "31.26",
          "chgp": "206.94%",
          "chgp_class": "positive"
        },
        {
          "field": "Consolidate Net Profit",
          "val1": "-22.43",
          "val2": "-33.17",
          "chgp": "32.38%",
          "chgp_class": "positive"
        },
        {
          "field": "Operating Profit Margin (Excl OI)",
          "val1": "-133.74%",
          "val2": "-510.78%",
          "chgp": "377.04%",
          "chgp_class": "positive"
        }
      ]
    }
  }
]

Quarterly Results Snapshot (Consolidated) - Jun'26 - QoQstock-summary

Jun'26
Mar'26
Change(%)
Net Sales
137.16
133.74
2.56%
Operating Profit (PBDIT) excl Other Income
-71.73
-76.35
6.05%
Interest
0.33
0.32
3.13%
Exceptional Items
0.00
94.72
-100.00%
Consolidate Net Profit
-39.68
22.50
-276.36%
Operating Profit Margin (Excl OI)
-52.62%
-57.30%
4.68%
Values in Rs Cr.
Direction Arrows
Net Sales

QoQ Growth in quarter ended Jun 2026 is 2.56% vs 397.92% in Mar 2026

Direction Arrows
Consolidated Net Profit

QoQ Growth in quarter ended Jun 2026 is -276.36% vs 213.92% in Mar 2026

Half Yearly Results Snapshot (Consolidated) - Sep'25stock-summary

Sep'25
Sep'24
Change(%)
Net Sales
50.99
21.41
138.16%
Operating Profit (PBDIT) excl Other Income
-141.69
-115.10
-23.10%
Interest
0.74
0.29
155.17%
Exceptional Items
1.23
6.12
-79.90%
Consolidate Net Profit
-25.18
-27.49
8.40%
Operating Profit Margin (Excl OI)
-279.19%
-539.11%
259.92%
Values in Rs Cr.
Direction Arrows
Net Sales

Growth in half year ended Sep 2025 is 138.16% vs -92.18% in Sep 2024

Direction Arrows
Consolidated Net Profit

Growth in half year ended Sep 2025 is 8.40% vs -122.58% in Sep 2024

Nine Monthly Results Snapshot (Consolidated) - Dec'25stock-summary

Dec'25
Dec'24
Change(%)
Net Sales
77.85
33.19
134.56%
Operating Profit (PBDIT) excl Other Income
-205.35
-176.37
-16.43%
Interest
1.08
0.43
151.16%
Exceptional Items
1.23
9.35
-86.84%
Consolidate Net Profit
-44.93
-44.17
-1.72%
Operating Profit Margin (Excl OI)
-263.78%
-531.39%
267.61%
Values in Rs Cr.
Direction Arrows
Net Sales

YoY Growth in nine months ended Dec 2025 is 134.56% vs -91.88% in Dec 2024

Direction Arrows
Consolidated Net Profit

YoY Growth in nine months ended Dec 2025 is -1.72% vs -120.59% in Dec 2024

Annual Results Snapshot (Consolidated) - Mar'26stock-summary

Mar'26
Mar'25
Change(%)
Net Sales
211.59
46.82
351.92%
Operating Profit (PBDIT) excl Other Income
-281.70
-238.23
-18.25%
Interest
1.40
0.67
108.96%
Exceptional Items
95.95
31.26
206.94%
Consolidate Net Profit
-22.43
-33.17
32.38%
Operating Profit Margin (Excl OI)
-133.74%
-510.78%
377.04%
Values in Rs Cr.
Direction Arrows
Net Sales

YoY Growth in year ended Mar 2026 is 351.92% vs -87.31% in Mar 2025

Direction Arrows
Consolidated Net Profit

YoY Growth in year ended Mar 2026 is 32.38% vs -114.91% in Mar 2025

stock-summaryCompany CV
About 63 Moons Technologies Ltd stock-summary
stock-summary
63 Moons Technologies Ltd
Small Cap
Computers - Software & Consulting
63 Moons Technologies Limited was initially incorporated as 'Worldwide Technologies Limited' on April 12, 1988, which changed the name to 'NODS Worldwide Limited' in July, 1999, to 'e.Xchange on the Net Limited' in December, 2000 to 'Financial Technologies (India) Limited' in April, 2001 and further to '63 Moons Technologies Limited' on May 27, 2016.
Company Coordinates stock-summary
Company Details
Shakti Tower-1, Premises E, 766 Anna Salai Thousand Lights Chennai Tamil Nadu : 600002
stock-summary
Tel: 91-44-43950850/51
stock-summary
info@ftindia.com
Registrar Details
Karvy Computershare Pvt Ltd., Karvy Selenium, Tower-B Plot No 31 & 32, Survey No 116/22, 115/24, 115/25, Financial District, Nanakramguda, Serilingampally, Mandal Ranga Reddy Dist, Hyderabad