
Compare A-1 with Similar Stocks
Total Returns (Price + Dividend) 
Latest dividend: 0.0006000000000000001 per share ex-dividend date: Sep-04-2025
Risk Adjusted Returns v/s
Returns Beta

News
A-1 Ltd Q1 FY27: Stellar Quarter Masks Deeper Structural Concerns
A-1 Limited, a micro-cap chemical manufacturer with a market capitalisation of ₹249.00 crores, delivered a remarkable performance in Q1 FY27 with consolidated net profit surging 426.67% year-on-year to ₹3.16 crores. However, the stock's dramatic 86.16% plunge from its 52-week high of ₹41.25 to the current price of ₹5.71 reflects mounting investor concerns about sustainability and quality of earnings, despite the impressive quarterly numbers.
Read full news article
A-1 Ltd is Rated Sell by MarketsMOJO
A-1 Ltd is rated 'Sell' by MarketsMOJO, with this rating last updated on 19 June 2026. However, the analysis and financial metrics discussed here reflect the stock's current position as of 25 July 2026, providing investors with the latest insights into the company’s performance and outlook.
Read full news article
A-1 Ltd is Rated Sell by MarketsMOJO
A-1 Ltd is rated 'Sell' by MarketsMOJO, with this rating last updated on 19 June 2026. However, the analysis and financial metrics discussed here reflect the stock's current position as of 14 July 2026, providing investors with an up-to-date view of the company’s fundamentals, valuation, financial trends, and technical outlook.
Read full news article Announcements
Financial Results For The Quarter Ended 30.06.2026
28-Jul-2026 | Source : BSEFinancial results for the quarter ended 30.06.2026
Integrated Governance Financial For The Quarter Ended On 30Th June2026
28-Jul-2026 | Source : BSEIntegrated Governance financial for the quarter ended on 30th June2026
Board Meeting Outcome for Approval Of Standalone And Consolidated Quarterly Financial Results For The Quarter Ended 30.06.2026.
28-Jul-2026 | Source : BSEApproval of Standalone and Consolidated Quarterly Financial results for the quarter ended 30.06.2026.
Corporate Actions

No Upcoming Board Meetings

A-1 Ltd has declared 15% dividend, ex-date: 04 Sep 25

A-1 Ltd has announced 1:10 stock split, ex-date: 08 Jan 26

A-1 Ltd has announced 3:1 bonus issue, ex-date: 31 Dec 25

No Rights history available
Quality key factors
Valuation key factors
Technicals key factors
 Technical Indicator Scale: Bearish, Mildly Bearish, Sideways, Mildly Bullish, Bullish Turned
 Shareholding Snapshot : Jun 2026
Shareholding Compare (%holding)
Promoters
None
Held by 0 Schemes
Held by 5 FIIs (2.51%)
Harshadkumar Naranbhai Patel (35.0%)
Vijay Kumar Bhandari Huf (2.94%)
23.43%
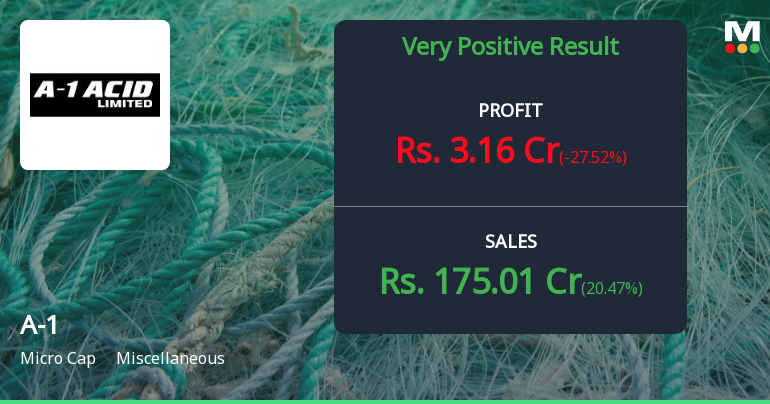
Quarterly Results Snapshot (Consolidated) - Jun'26 - QoQ

QoQ Growth in quarter ended Jun 2026 is 20.47% vs 108.09% in Mar 2026
QoQ Growth in quarter ended Jun 2026 is -27.52% vs 354.17% in Mar 2026
Half Yearly Results Snapshot (Consolidated) - Sep'25
Growth in half year ended Sep 2025 is -12.64% vs 37.83% in Sep 2024
Growth in half year ended Sep 2025 is -62.98% vs 1,192.86% in Sep 2024
Nine Monthly Results Snapshot (Consolidated) - Dec'25
YoY Growth in nine months ended Dec 2025 is -10.43% vs 49.17% in Dec 2024
YoY Growth in nine months ended Dec 2025 is -41.99% vs 702.86% in Dec 2024
Annual Results Snapshot (Consolidated) - Mar'26
YoY Growth in year ended Mar 2026 is 3.45% vs 54.02% in Mar 2025
YoY Growth in year ended Mar 2026 is 64.11% vs 231.82% in Mar 2025
About A-1 Ltd

Company Coordinates


