
Dashboard
Falling Participation by Institutional Investors
- Institutional investors have decreased their stake by -1.01% over the previous quarter and collectively hold 2.13% of the company
- These investors have better capability and resources to analyse fundamentals of companies than most retail investors
Underperformed the market in the last 1 year
Stock DNA
Cables - Electricals
INR 1,651 Cr (Small Cap)
21.00
45
0.07%
-0.01
18.82%
4.00
Total Returns (Price + Dividend) 
Latest dividend: 0.5 per share ex-dividend date: Jun-23-2025
Risk Adjusted Returns v/s
Returns Beta

News
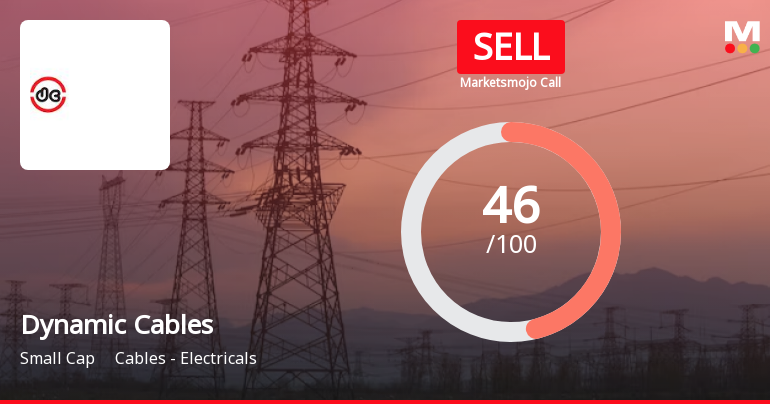
Dynamic Cables Ltd is Rated Sell
Dynamic Cables Ltd is rated 'Sell' by MarketsMOJO. This rating was last updated on 08 Dec 2025, reflecting a reassessment of the stock's outlook. However, all fundamentals, returns, and financial metrics discussed below are based on the company's current position as of 25 December 2025, providing investors with the most up-to-date analysis.
Read More
Dynamic Cables: Analytical Perspective Shifts Amid Mixed Financial and Technical Signals
Dynamic Cables, a key player in the electrical cables sector, has experienced a revision in its market assessment driven by a combination of technical indicators, valuation metrics, financial trends, and investor participation. Despite positive quarterly financial results, the stock’s recent performance and technical outlook have influenced a shift in analytical perspective.
Read More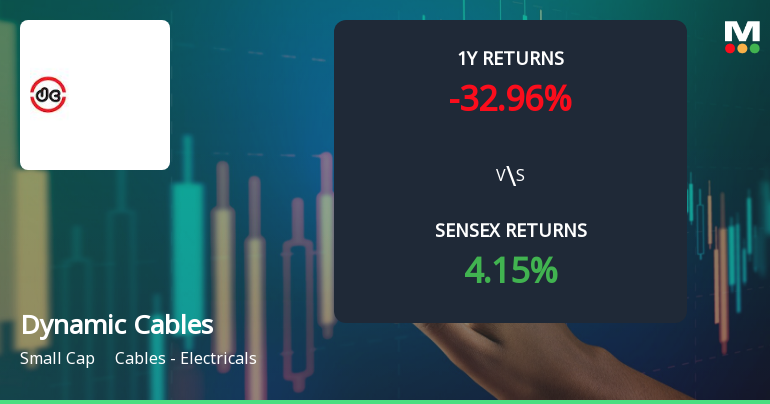
Dynamic Cables Technical Momentum Shifts Amid Bearish Signals
Dynamic Cables, a key player in the Cables - Electricals sector, has experienced a notable shift in its technical momentum, with recent evaluation adjustments indicating a more bearish outlook across multiple timeframes. This article analyses the latest technical indicators including MACD, RSI, moving averages, and other momentum oscillators to provide a comprehensive view of the stock’s current market stance.
Read More Announcements
Intimation Of Grant Of Employee Stock Options Under Dynam?? ??bles Limited - Employee Stock Option Plan 2024
11-Dec-2025 | Source : BSEIntimation of Grant of Employee Stock Options under Dynamic Cables Limited- Employee Sock Option Plan 2024
Disclosure Under Regulation 30 Of SEBI (Listing Obligations And Disclosure Requirements) Regulations 2015
29-Nov-2025 | Source : BSEIntimation under Regulation 30 of SEBI (Listing Obligations and Disclosure Requirements) Regulations 2015 - Company has received approval from Power Grid Corporation of India Limited for the manufacturing & supply of ASCR and AL59 (upto 61 strands) for its manufacturing plant.
Disclosure Under Regulation 30 Of SEBI (Listing Obligations And Disclosure Requirements) Regulations 2015
28-Nov-2025 | Source : BSEIntimation under Regulation 30 of SEBI (Listing Obligations and Disclosure Requirements) Regulations 2015- Company has received UL Certification for cables covered under in UL 854 standard from UL Solutions.
Corporate Actions

No Upcoming Board Meetings

Dynamic Cables Ltd has declared 5% dividend, ex-date: 23 Jun 25

No Splits history available

Dynamic Cables Ltd has announced 1:1 bonus issue, ex-date: 11 Jul 25

No Rights history available
Quality key factors
Valuation key factors
Technicals key factors
 Technical Indicator Scale: Bearish, Mildly Bearish, Sideways, Mildly Bullish, Bullish Turned
 Shareholding Snapshot : Sep 2025
Shareholding Compare (%holding)
Promoters
None
Held by 0 Schemes
Held by 5 FIIs (0.56%)
Ashish Mangal (31.81%)
None
25.15%
Quarterly Results Snapshot (Standalone) - Sep'25 - YoY

YoY Growth in quarter ended Sep 2025 is 20.25% vs 52.53% in Sep 2024
YoY Growth in quarter ended Sep 2025 is 41.81% vs 172.10% in Sep 2024
Half Yearly Results Snapshot (Standalone) - Sep'25
Growth in half year ended Sep 2025 is 22.79% vs 32.23% in Sep 2024
Growth in half year ended Sep 2025 is 48.68% vs 54.52% in Sep 2024
Nine Monthly Results Snapshot (Standalone) - Dec'24

YoY Growth in nine months ended Dec 2024 is 31.70% vs 7.54% in Dec 2023
YoY Growth in nine months ended Dec 2024 is 71.95% vs 14.08% in Dec 2023
Annual Results Snapshot (Standalone) - Mar'25
YoY Growth in year ended Mar 2025 is 33.51% vs 14.86% in Mar 2024
YoY Growth in year ended Mar 2025 is 71.62% vs 21.80% in Mar 2024
About Dynamic Cables Ltd

Company Coordinates


