
Compare AAON, Inc. with Similar Stocks
Dashboard
1
With a fall in Net Sales of -3.26%, the company declared Very Negative results in Jun 25
- The company has declared negative results for the last 2 consecutive quarters
- INTEREST COVERAGE RATIO(Q) Lowest at 1,086.61
- OPERATING CASH FLOW(Y) Lowest at USD 31.95 MM
- ROCE(HY) Lowest at 15.52%
2
With ROE of 19.47%, it has a very expensive valuation with a 9.64 Price to Book Value
3
Below par performance in long term as well as near term
Total Returns (Price + Dividend) 
TimePeriod
Price Return
Dividend Return
Total Return
3 Months
17.15%
0%
17.15%
6 Months
-27.64%
0%
-27.64%
1 Year
29.08%
0%
29.08%
2 Years
46.78%
0%
46.78%
3 Years
169.62%
0%
169.62%
4 Years
119.89%
0%
119.89%
5 Years
148.81%
0%
148.81%
AAON, Inc. for the last several years.
Risk Adjusted Returns v/s
News
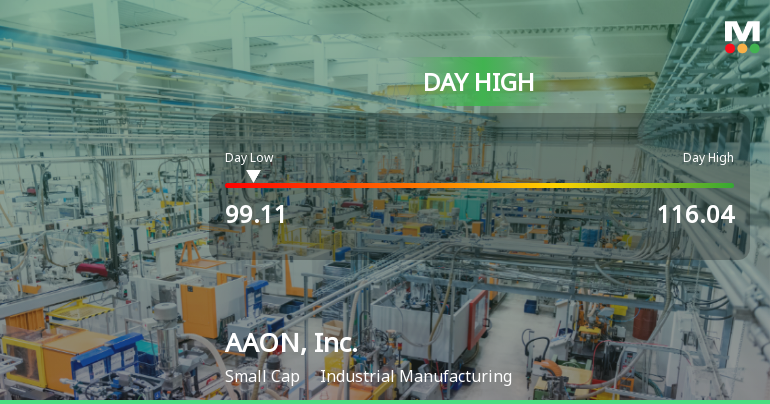
AAON, Inc. Stock Hits Day High with Strong 11.23% Surge
AAON, Inc. saw a notable increase in its stock price on November 6, 2025, reaching an intraday high. However, the company has struggled over the past year, with declines in net sales and year-to-date performance, highlighting mixed financial metrics and a premium valuation compared to peers.
Read full news article Announcements

No announcement available
Corporate Actions
No corporate action available
Quality key factors
Factor
Value
Sales Growth (5y)
20.32%
EBIT Growth (5y)
12.35%
EBIT to Interest (avg)
59.15
Debt to EBITDA (avg)
0.43
Net Debt to Equity (avg)
0.33
Sales to Capital Employed (avg)
1.31
Tax Ratio
17.39%
Dividend Payout Ratio
20.84%
Pledged Shares
0
Institutional Holding
89.35%
ROCE (avg)
22.63%
ROE (avg)
18.85%
Valuation key factors
Factor
Value
P/E Ratio
50
Industry P/E
Price to Book Value
9.64
EV to EBIT
41.25
EV to EBITDA
30.62
EV to Capital Employed
7.50
EV to Sales
6.45
PEG Ratio
NA
Dividend Yield
0.30%
ROCE (Latest)
18.18%
ROE (Latest)
19.47%
Technicals key factors
Indicator
Weekly
Monthly
MACD
Mildly Bullish
Mildly Bearish
RSI
No Signal
No Signal
Bollinger Bands
Mildly Bullish
Mildly Bearish
Moving Averages
Mildly Bearish (Daily)
KST
Bearish
Mildly Bearish
Dow Theory
No Trend
Mildly Bearish
OBV
No Trend
Mildly Bullish
 Technical Indicator Scale: Bearish, Mildly Bearish, Sideways, Mildly Bullish, Bullish Turned
 Shareholding Snapshot : Sep 2025
Shareholding Compare (%holding)
Majority shareholders
Domestic Funds
Domestic Funds
Held in 121 Schemes (62.68%)
Foreign Institutions
Held by 155 Foreign Institutions (13.02%)
Strategic Entities with highest holding
Highest Public shareholder
Quarterly Results Snapshot (Consolidated) - Jun'25 - QoQ
Jun'25
Mar'25
Change(%)
Net Sales
311.60
322.10
-3.26%
Operating Profit (PBDIT) excl Other Income
43.60
54.00
-19.26%
Interest
4.00
2.80
42.86%
Exceptional Items
0.00
0.00
Consolidate Net Profit
15.50
29.30
-47.10%
Operating Profit Margin (Excl OI)
75.70%
108.90%
-3.32%
USD in Million.

Net Sales
QoQ Growth in quarter ended Jun 2025 is -3.26% vs 8.20% in Mar 2025
Consolidated Net Profit
QoQ Growth in quarter ended Jun 2025 is -47.10% vs 18.62% in Mar 2025
Annual Results Snapshot (Consolidated) - Dec'24
Dec'24
Dec'23
Change(%)
Net Sales
1,200.60
1,168.50
2.75%
Operating Profit (PBDIT) excl Other Income
272.00
274.30
-0.84%
Interest
2.90
4.80
-39.58%
Exceptional Items
0.00
0.00
Consolidate Net Profit
168.60
177.60
-5.07%
Operating Profit Margin (Excl OI)
174.20%
194.70%
-2.05%
USD in Million.
Net Sales
YoY Growth in year ended Dec 2024 is 2.75% vs 31.47% in Dec 2023
Consolidated Net Profit
YoY Growth in year ended Dec 2024 is -5.07% vs 76.89% in Dec 2023
About AAON, Inc.

AAON, Inc.
Industrial Manufacturing
AAON, Inc. is engaged in the engineering, manufacturing, marketing and sale of air conditioning and heating equipment consisting of standard, semi-custom and custom rooftop units, chillers, packaged outdoor mechanical rooms, air handling units, makeup air units, energy recovery units, condensing units, geothermal/water-source heat pumps and coils. Its products serve the commercial and industrial new construction and replacement markets. Its rooftop and condensing unit markets consist of units installed on commercial or industrial structures of less than 10 stories in height. Its air handling units, self-contained units, geothermal/water-source heat pumps, chillers, packaged outdoor mechanical rooms and coils are applicable to all sizes of commercial and industrial buildings. The replacement market consists of products installed to replace existing units/components that are worn or damaged.
Company Coordinates
Company Details
2425 S Yukon Ave , TULSA OK : 74107-2728


Registrar Details
InfinHub Market Technologies FZ-LLC, Building-2, Unit 112, Dubai Internet City, Dubai, United Arab Emirates
GET THE MARKETSMOJO APP


Company
Stocks
Portfolio


"Investment in securities markets are subject to market risk. Read all the related documents carefully before investing."